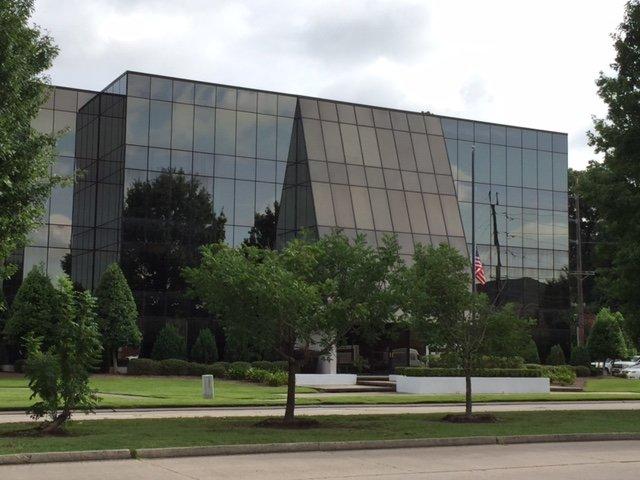
Office Space
5757 Corporate Boulevard Baton Rouge, LA 70808
5757 Corporate Boulevard Baton Rouge, LA 70808
Details & Description
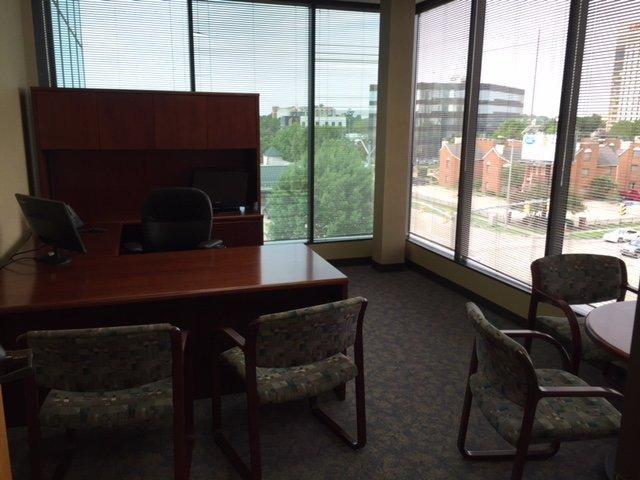
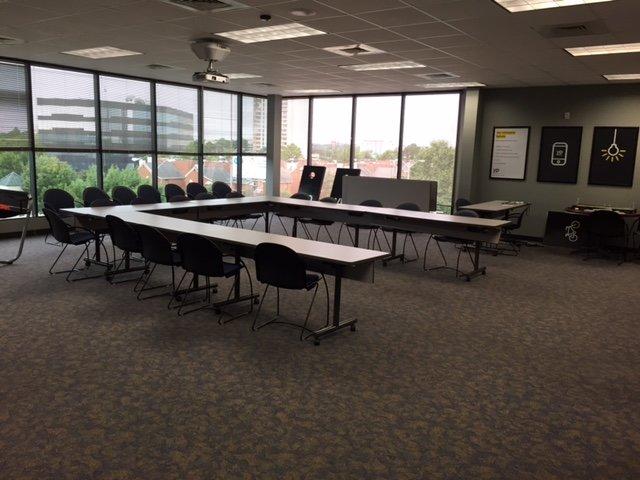
Additional Photos


Listing Agents

Robert Hebert
O: 225-295-0800
M: 225-937-8772
rhebert@latterblum.com
O: 225-295-0800
M: 225-937-8772
rhebert@latterblum.com
While we strive to provide the most accurate information, all listing information, and demographic data, is provided by third-parties. As such, MyEListing will not be responsible for the accuracy of the information. It is strongly recommended that you verify all information with the listing agent, and any relevant agencies, prior to making any decisions.


