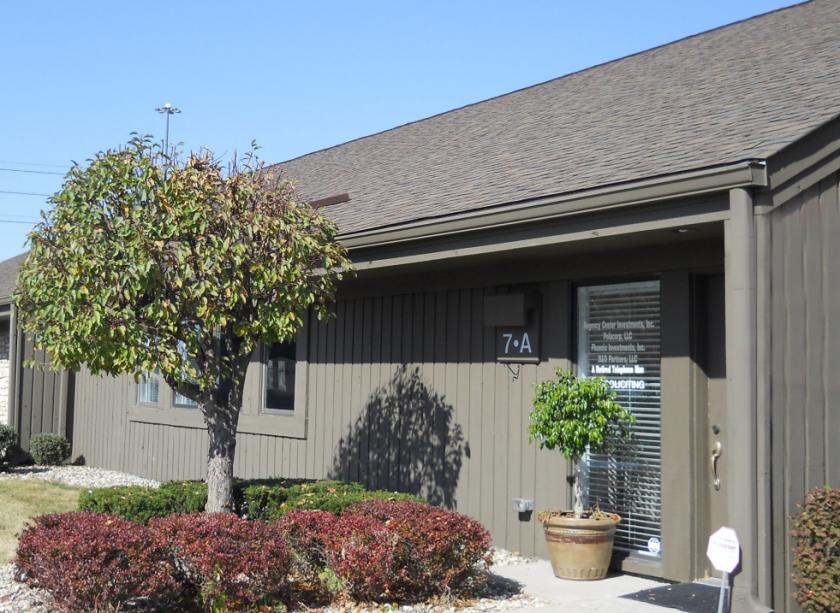
1-Mile | 3-Miles | 5-Miles | ||
---|---|---|---|---|
Total Population | 7,368 | 54,852 | 179,400 | |
Population Median Age | 41 | 39 | 39 | |
Population by Age | 0-9 Yrs | 492 (6%) | 5417 (9%) | 21536 (12%) |
10-19 Yrs | 604 (8%) | 6020 (10%) | 22299 (12%) | |
20-29 Yrs | 1382 (18%) | 9119 (16%) | 24928 (13%) | |
30-39 Yrs | 1356 (18%) | 8313 (15%) | 26673 (14%) | |
40-49 Yrs | 912 (12%) | 6575 (11%) | 22171 (12%) | |
50-59 Yrs | 1043 (14%) | 7701 (14%) | 24287 (13%) | |
60-69 Yrs | 898 (12%) | 6428 (11%) | 20521 (11%) | |
70+ Yrs | 681 (9%) | 5279 (9%) | 16985 (9%) | |
Median HH Income | $44,664 | $66,167 | $71,364 | |
Total Household Income | < 24K | 823 (19%) | 3369 (13%) | 11079 (14%) |
25-49K | 1473 (35%) | 6152 (24%) | 16104 (21%) | |
50-74K | 777 (18%) | 4650 (18%) | 12418 (16%) | |
75-99K | 435 (10%) | 3442 (13%) | 9728 (12%) | |
100-199K | 491 (11%) | 5942 (23%) | 19124 (25%) | |
200K+ | 151 (3%) | 1847 (7%) | 7363 (9%) | |
Highest Education Level | No Diploma | 224 | 1078 | 7176 |
Diploma or GED | 1185 | 6384 | 21345 | |
Some College | 1173 | 6949 | 21352 | |
Assoc. Degree | 579 | 2939 | 8807 | |
Bachelors Degree | 1602 | 14237 | 42450 | |
Higher Degree | 800 | 8273 | 24774 | |
Total Housing Units | 4,503 | 26,759 | 80,495 | |
--Owner-Occupied | 1,522 | 14,237 | 47,424 | |
--Renter-Occupied | 2,628 | 11,165 | 28,391 | |
Owner-Occupied Values | < 100K | 40 | 422 | 4233 |
100-199K | 1102 | 6874 | 18585 | |
200-299K | 323 | 3714 | 11900 | |
300-399K | 43 | 1853 | 6596 | |
400-499K | 0 | 711 | 2933 | |
500K+ | 14 | 664 | 3178 | |
Total Working Age Population | 6,517 | 45,661 | 143,043 | |
In Work Force | 4,645 | 33,238 | 102,224 | |
Not In Work Force | 1,872 | 12,423 | 40,820 | |
Workforce Employed | 4,526 | 32,045 | 97,741 | |
Workforce Unemployed | 120 | 1,141 | 4,357 | |
Civlian Workforce | 4,645 | 33,186 | 102,099 | |
Military Workforce | 0 | 52 | 125 | |
Total Households | 4,150 | 25,402 | 75,816 | |
Family Households | 1,354 | 12,654 | 43,539 | |
Non-Family Households | 2,795 | 12,748 | 32,277 | |
Married Couple | 1,005 | 10,041 | 33,940 | |
Other Family | 350 | 2,613 | 9,598 | |
Married w/Child | 366 | 3,683 | 13,184 | |
Single Male w/Child | 0 | 362 | 1,217 | |
Single Female w/Child | 151 | 1,071 | 4,365 |
Population Change Last Two Decades - Plus Projection
2000 | % | 2010 | % | 2020 | % | 2030 | |
---|---|---|---|---|---|---|---|
Indiana | 6,080,485 | +7 | 6,483,802 | +4 | 6,738,573 | +4 | 7,014,880 |
Hamilton County | 182,740 | +50 | 274,569 | +25 | 343,179 | +22 | 417,754 |
Hancock County | 55,391 | +26 | 70,002 | +9 | 76,353 | +11 | 85,043 |
Marion County | 860,454 | +5 | 903,393 | +7 | 963,732 | +4 | 1,001,231 |
Total Working Age Population:
Total Households:
Total Working Age Population:
Total Households:
Total Working Age Population:
Total Households: