Office Space
21275 Cleveland Road South Bend, IN 46628
21275 Cleveland Road South Bend, IN 46628
Details & Description
Property Highlights
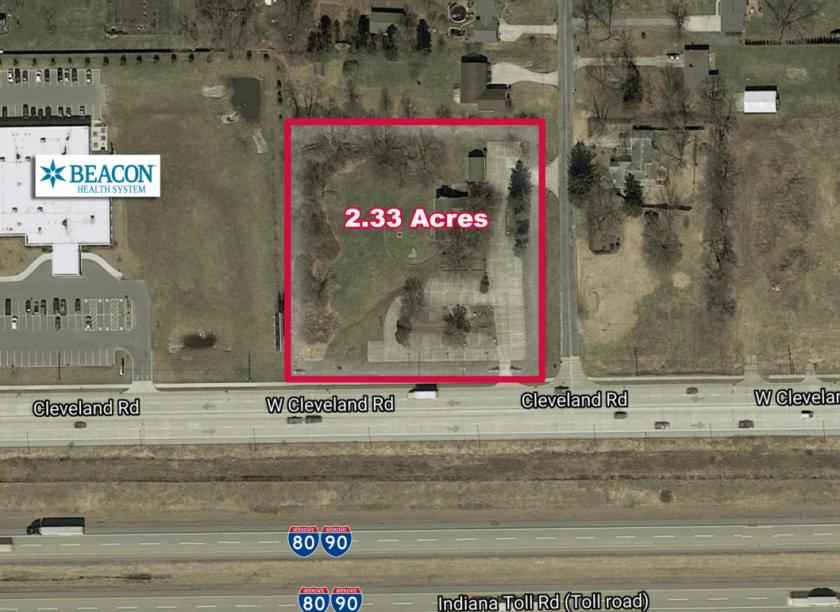
- • 2.33 acres on Cleveland Rd in South Bend
- • Adjacent to Beacon Medical Group facility
- • AADT 20,535
- • Zoned “OB” Office Buffer
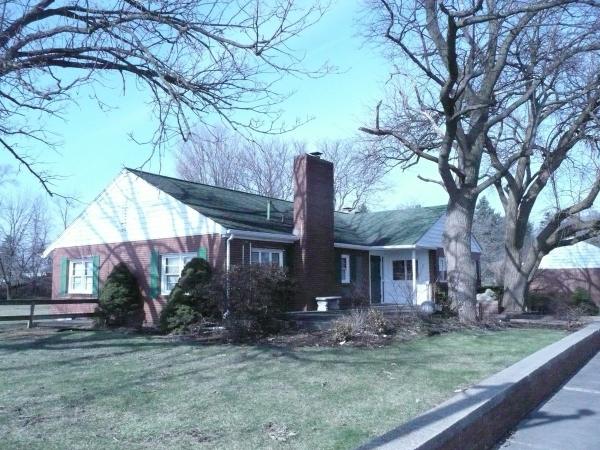
Additional Photos


Listing Agents

Richard Doolittle
O: 574-271-4060
M: 574-485-1535
rdoolittle@cressy.com
O: 574-271-4060
M: 574-485-1535
rdoolittle@cressy.com
While we strive to provide the most accurate information, all listing information, and demographic data, is provided by third-parties. As such, MyEListing will not be responsible for the accuracy of the information. It is strongly recommended that you verify all information with the listing agent, and any relevant agencies, prior to making any decisions.


