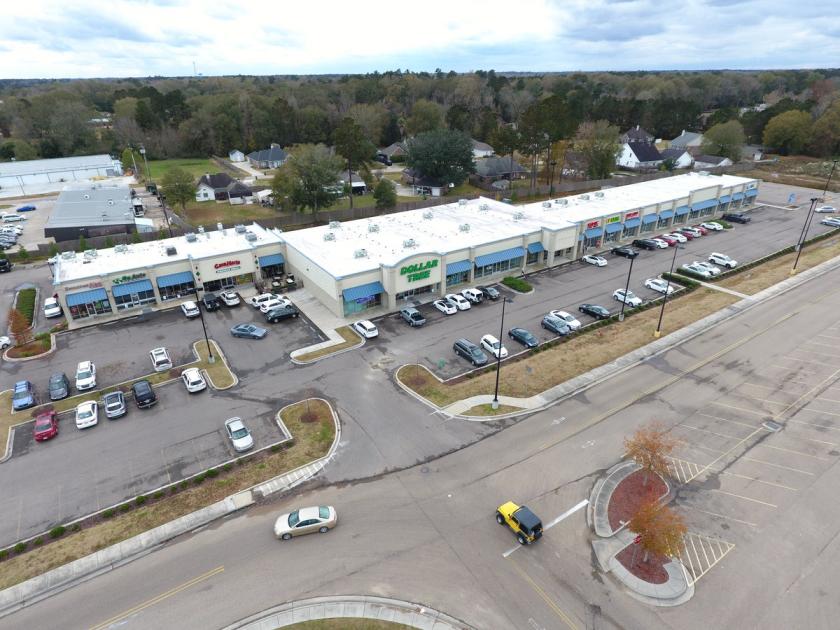
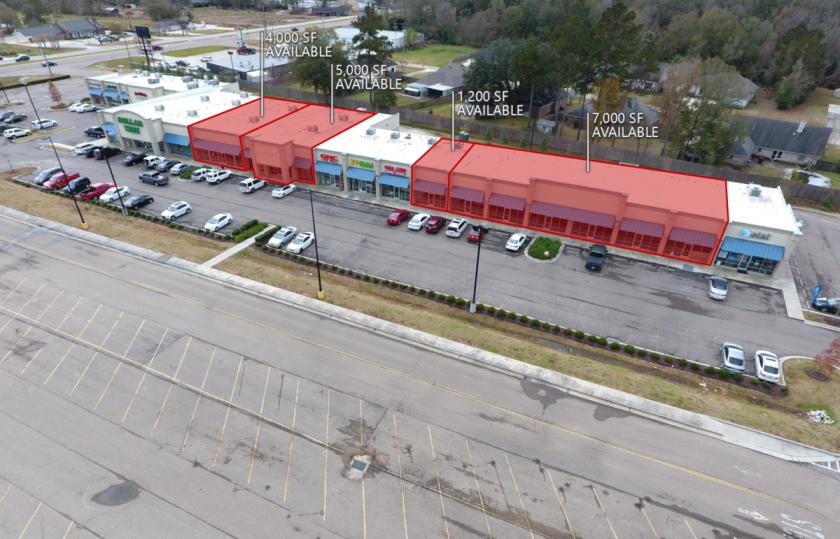
Retail Space
33939 La Highway 16 Denham Springs, LA 70706
33939 La Highway 16 Denham Springs, LA 70706
Details & Description
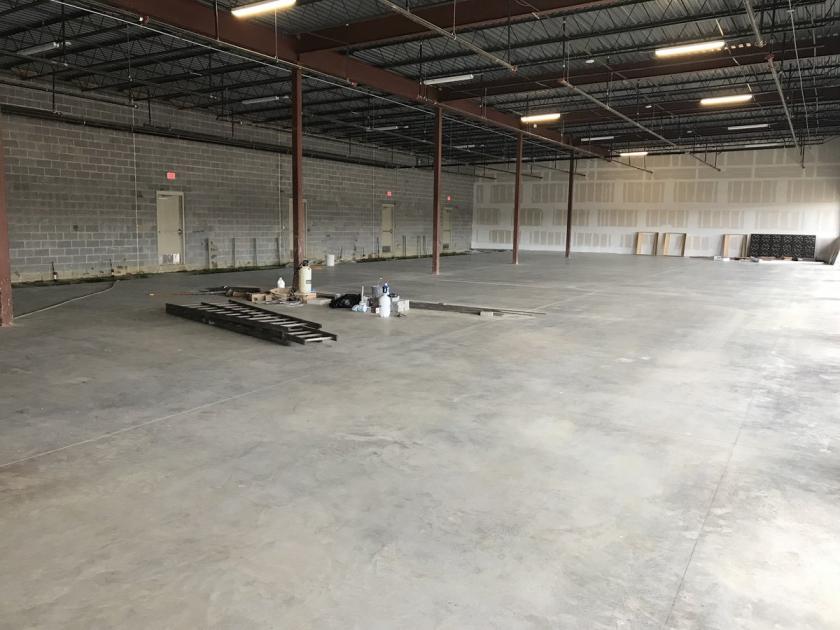
Additional Photos


Listing Agents

Andrew DOstilio
O: 225-295-0800
M: 225-678-8851
andrewdos@latterblum.com
O: 225-295-0800
M: 225-678-8851
andrewdos@latterblum.com

Mignon Richard
O: 504-525-1311
M: 504-569-9461
mignon@latterblum.com
O: 504-525-1311
M: 504-569-9461
mignon@latterblum.com

Clinton Shepard
O: 318-366-6064
M: 318-366-6064
cshepard@latterblum.com
O: 318-366-6064
M: 318-366-6064
cshepard@latterblum.com
While we strive to provide the most accurate information, all listing information, and demographic data, is provided by third-parties. As such, MyEListing will not be responsible for the accuracy of the information. It is strongly recommended that you verify all information with the listing agent, and any relevant agencies, prior to making any decisions.


