Specialty Real Estate
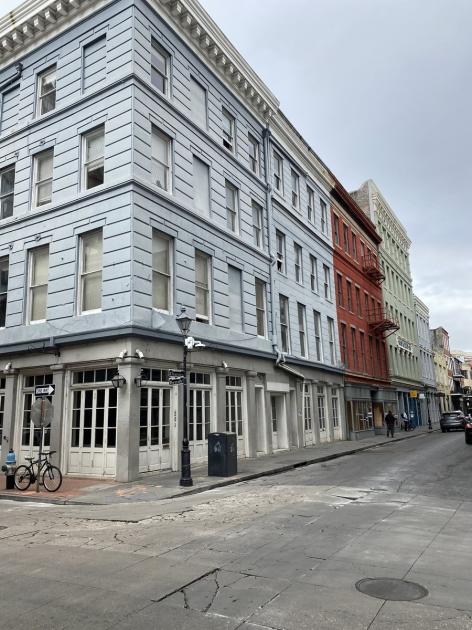
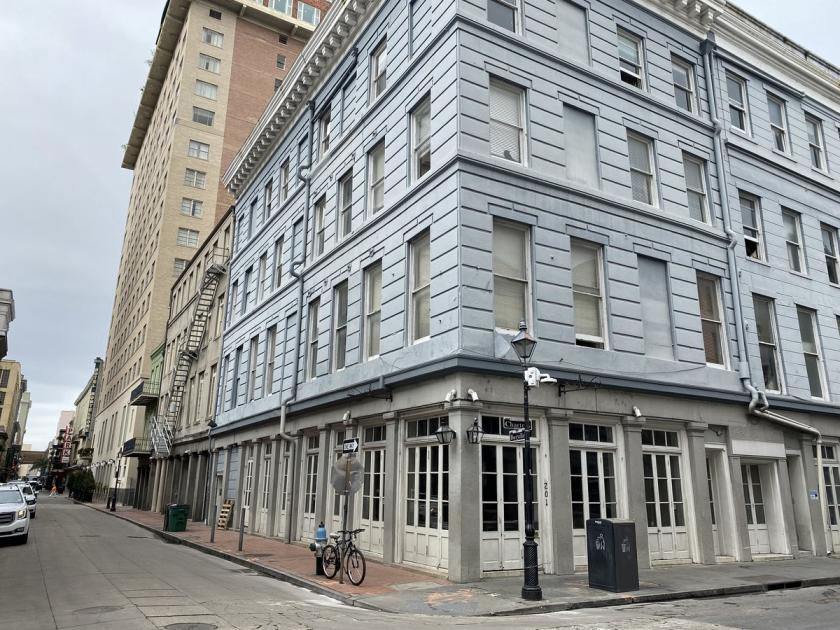
201 Chartres Street New Orleans, LA 70130
201 Chartres Street New Orleans, LA 70130
Details & Description
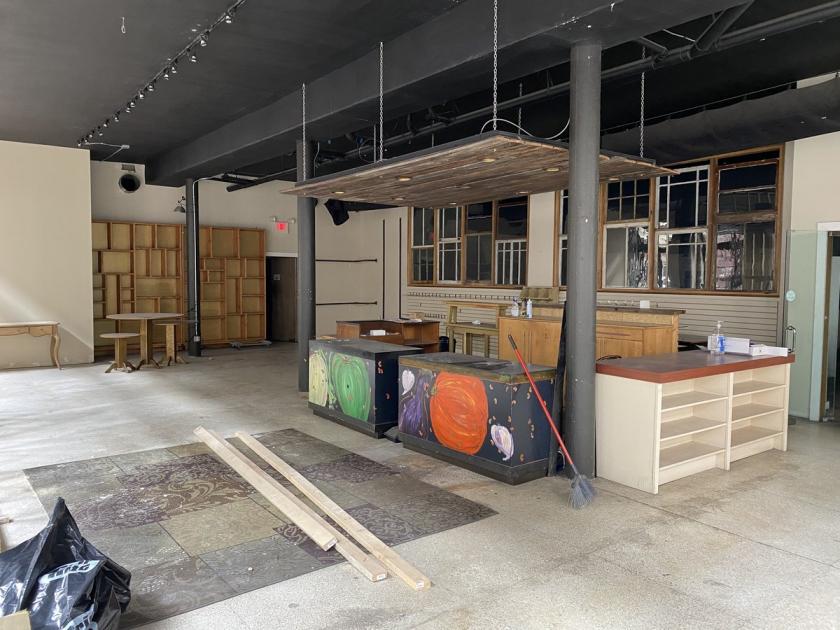
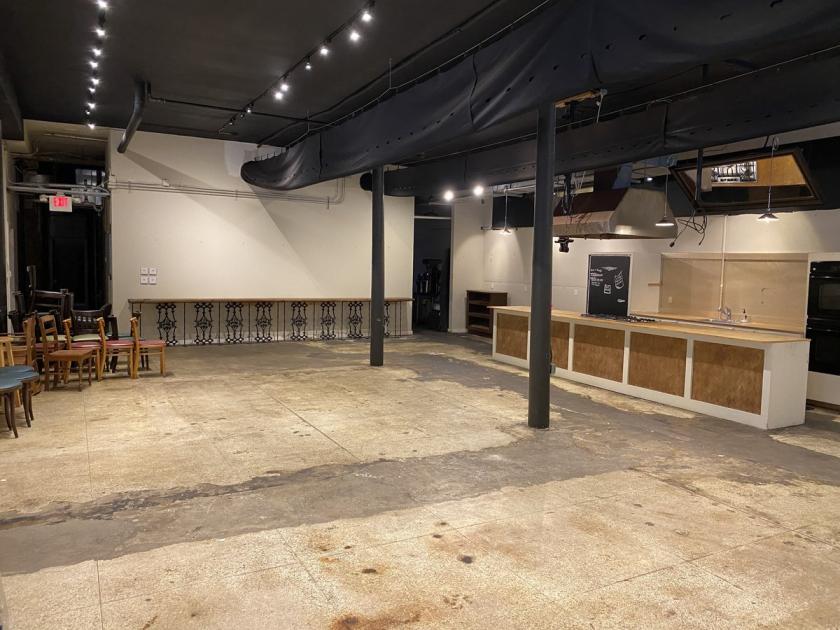
Additional Photos

Listing Agents

Schaffer Mickal
O: 504-525-1311
M: 504-569-9495
smickal@latterblum.com
O: 504-525-1311
M: 504-569-9495
smickal@latterblum.com

Rhett Hymel
O: 504-525-1311
M: 225-773-3990
rhymel@latterblum.com
O: 504-525-1311
M: 225-773-3990
rhymel@latterblum.com
While we strive to provide the most accurate information, all listing information, and demographic data, is provided by third-parties. As such, MyEListing will not be responsible for the accuracy of the information. It is strongly recommended that you verify all information with the listing agent, and any relevant agencies, prior to making any decisions.


