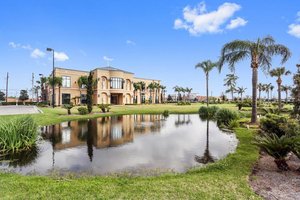
1-Mile | 3-Miles | 5-Miles | ||
---|---|---|---|---|
Total Population | 14,991 | 50,838 | 129,775 | |
Population Median Age | 33 | 36 | 37 | |
Population by Age | 0-9 Yrs | 2655 (17%) | 7351 (14%) | 17937 (13%) |
10-19 Yrs | 1978 (13%) | 7087 (13%) | 16144 (12%) | |
20-29 Yrs | 2355 (15%) | 6599 (12%) | 17173 (13%) | |
30-39 Yrs | 2581 (17%) | 7910 (15%) | 21039 (16%) | |
40-49 Yrs | 1530 (10%) | 6076 (11%) | 15218 (11%) | |
50-59 Yrs | 1750 (11%) | 6833 (13%) | 17475 (13%) | |
60-69 Yrs | 1313 (8%) | 5103 (10%) | 14311 (11%) | |
70+ Yrs | 828 (5%) | 3879 (7%) | 10478 (8%) | |
Median HH Income | $41,714 | $46,259 | $42,249 | |
Total Household Income | < 24K | 1604 (33%) | 4585 (27%) | 14984 (32%) |
25-49K | 1118 (23%) | 4315 (25%) | 10968 (23%) | |
50-74K | 897 (18%) | 2851 (16%) | 7995 (17%) | |
75-99K | 444 (9%) | 1946 (11%) | 4565 (9%) | |
100-199K | 682 (14%) | 2663 (15%) | 6348 (13%) | |
200K+ | 40 (0%) | 413 (2%) | 1456 (3%) | |
Highest Education Level | No Diploma | 1842 | 5934 | 13502 |
Diploma or GED | 2978 | 10244 | 27125 | |
Some College | 2871 | 9282 | 22552 | |
Assoc. Degree | 723 | 2587 | 5970 | |
Bachelors Degree | 693 | 3239 | 11955 | |
Higher Degree | 353 | 2278 | 7524 | |
Total Housing Units | 5,365 | 18,688 | 54,204 | |
--Owner-Occupied | 2,396 | 11,002 | 26,257 | |
--Renter-Occupied | 2,390 | 5,771 | 20,059 | |
Owner-Occupied Values | < 100K | 217 | 1707 | 4410 |
100-199K | 1618 | 6387 | 13105 | |
200-299K | 494 | 2048 | 5497 | |
300-399K | 27 | 433 | 1687 | |
400-499K | 17 | 134 | 652 | |
500K+ | 24 | 293 | 906 | |
Total Working Age Population | 10,970 | 38,933 | 101,534 | |
In Work Force | 6,699 | 23,574 | 62,397 | |
Not In Work Force | 4,271 | 15,359 | 39,137 | |
Workforce Employed | 5,980 | 21,348 | 56,420 | |
Workforce Unemployed | 707 | 2,162 | 5,491 | |
Civlian Workforce | 6,687 | 23,510 | 61,911 | |
Military Workforce | 11 | 64 | 486 | |
Total Households | 4,786 | 16,773 | 46,316 | |
Family Households | 3,291 | 10,676 | 26,541 | |
Non-Family Households | 1,495 | 6,097 | 19,776 | |
Married Couple | 1,688 | 6,230 | 15,401 | |
Other Family | 1,602 | 4,446 | 11,140 | |
Married w/Child | 736 | 2,320 | 5,540 | |
Single Male w/Child | 222 | 602 | 1,119 | |
Single Female w/Child | 753 | 1,809 | 4,530 |
Population Change Last Two Decades - Plus Projection
2000 | % | 2010 | % | 2020 | % | 2030 | |
---|---|---|---|---|---|---|---|
Louisiana | 4,468,976 | +1 | 4,533,372 | +1 | 4,588,310 | +5 | 4,813,420 |
Jefferson Parish | 455,466 | -5 | 432,552 | +4 | 450,200 | +1 | 454,670 |
Lafourche Parish | 89,974 | +7 | 96,318 | 0 | 95,990 | 0 | 95,990 |
Orleans Parish | 484,674 | -29 | 343,829 | -26 | 255,440 | 0 | 256,010 |
Plaquemines Parish | 26,757 | -14 | 23,042 | +12 | 25,770 | +13 | 29,130 |
St. Bernard Parish | 67,229 | -47 | 35,897 | -38 | 22,210 | +1 | 22,480 |
Total Working Age Population:
Total Households:
Total Working Age Population:
Total Households:
Total Working Age Population:
Total Households: