Office Space
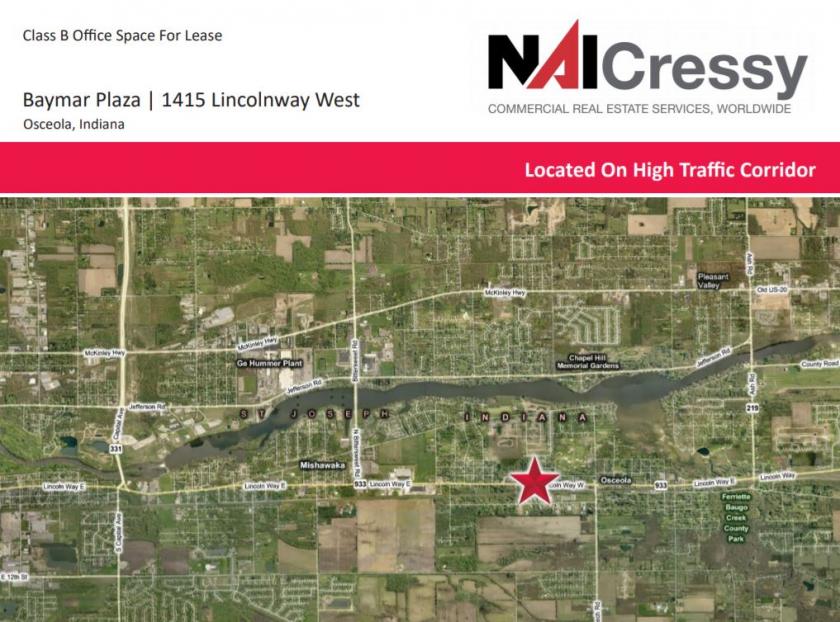
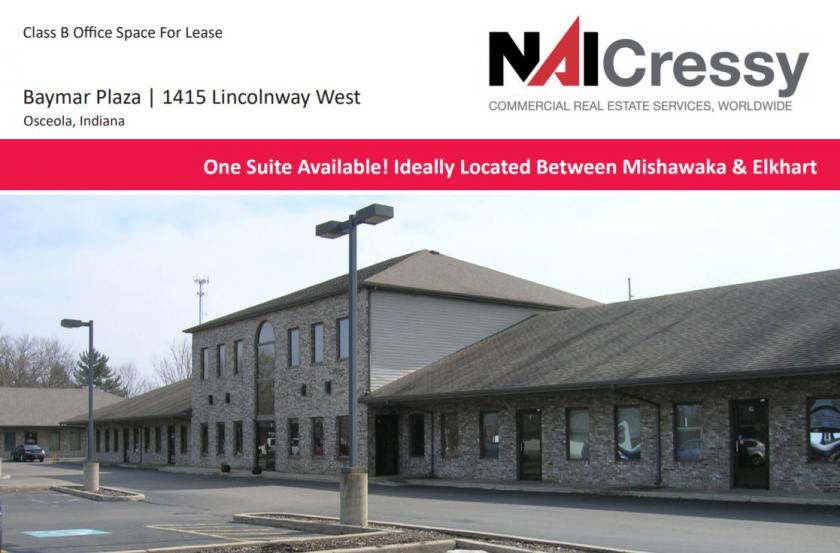
1415 Lincolnway West Osceola, IN 46561
1415 Lincolnway West Osceola, IN 46561
Details & Description
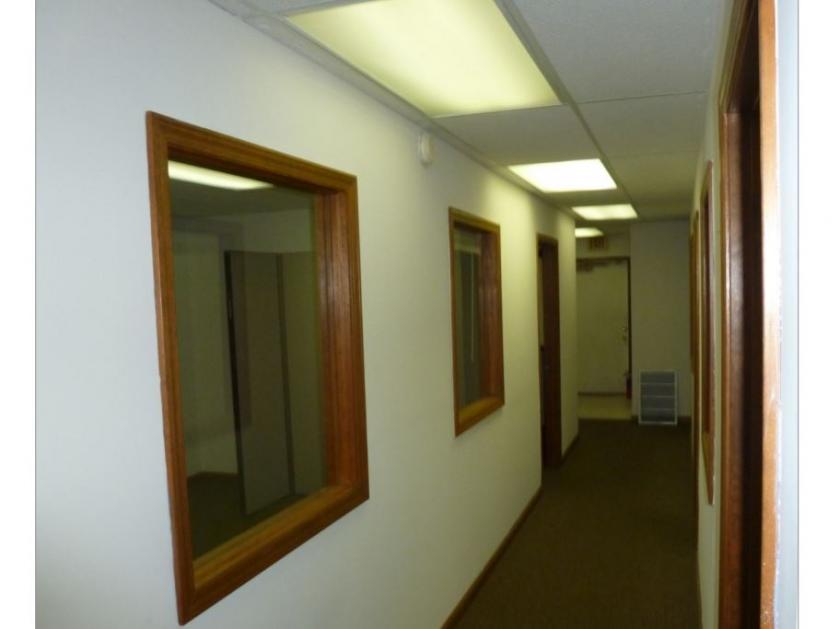
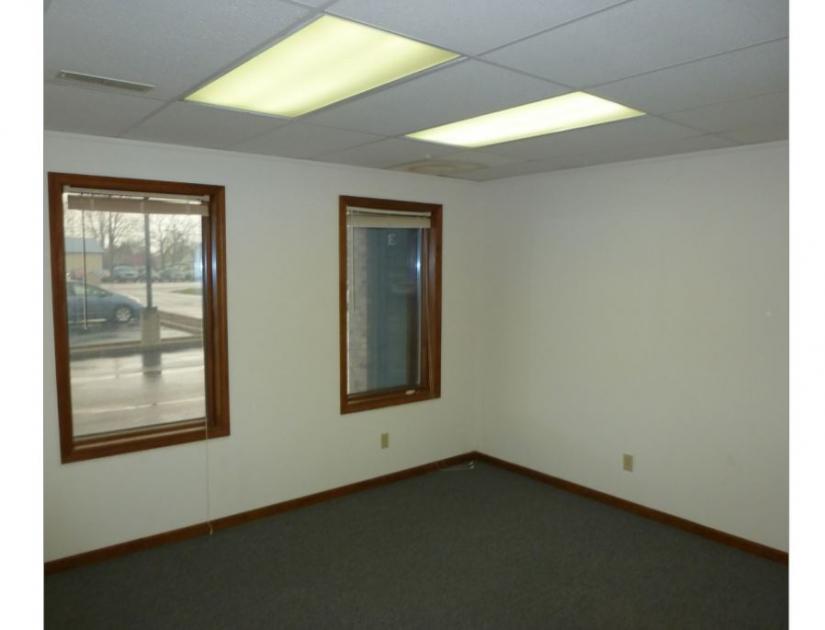
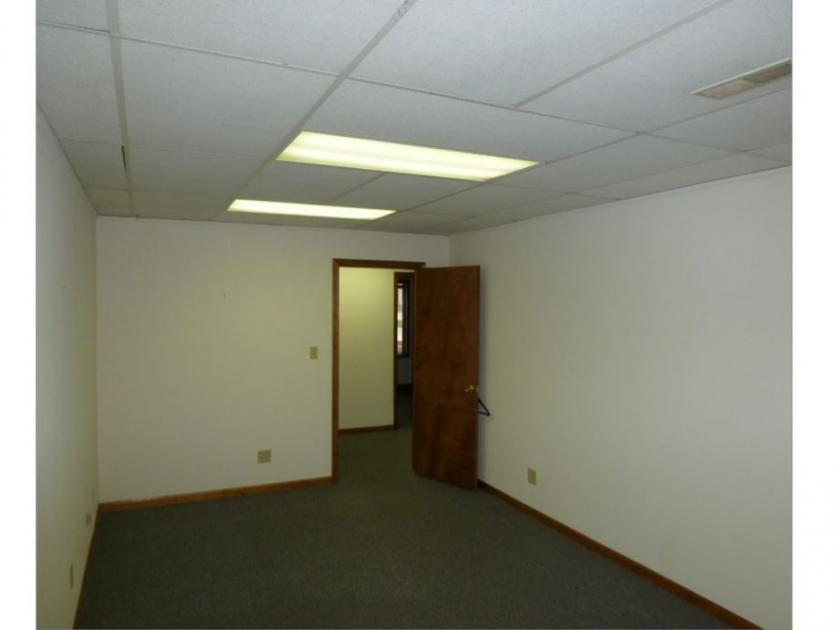
Additional Photos

Listing Agents

Shawn Todd
O: 574-271-4060
M: 574-485-1520
stodd@cressy.com
O: 574-271-4060
M: 574-485-1520
stodd@cressy.com
While we strive to provide the most accurate information, all listing information, and demographic data, is provided by third-parties. As such, MyEListing will not be responsible for the accuracy of the information. It is strongly recommended that you verify all information with the listing agent, and any relevant agencies, prior to making any decisions.