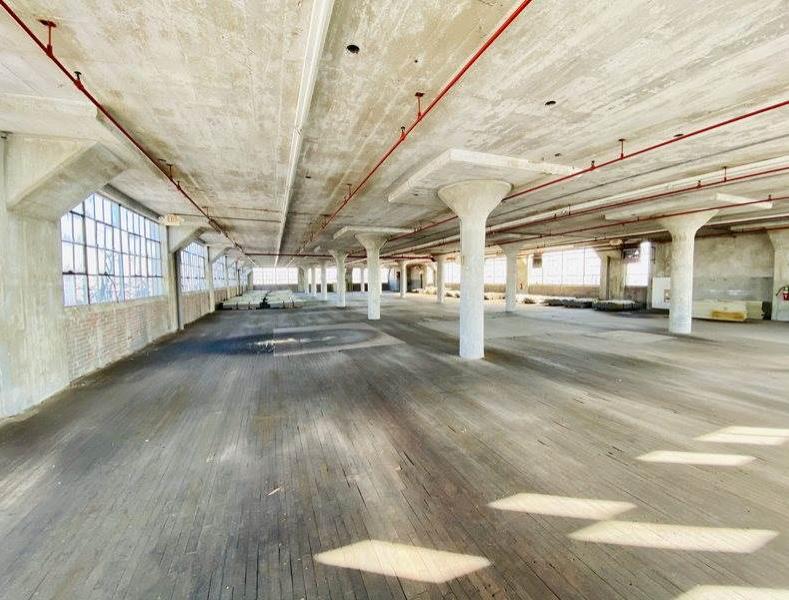
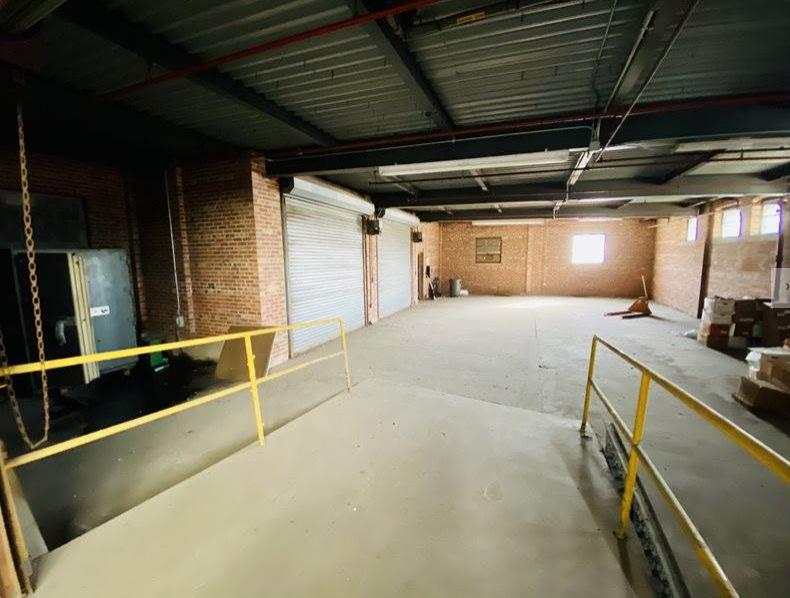
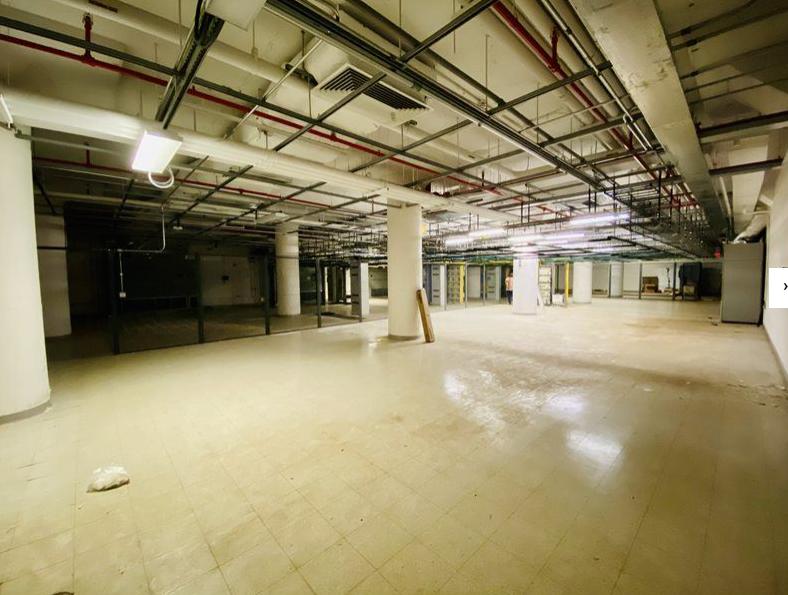
1-Mile | 3-Miles | 5-Miles | ||
---|---|---|---|---|
Total Population | 35,653 | 154,899 | 253,207 | |
Population Median Age | 35 | 37 | 38 | |
Population by Age | 0-9 Yrs | 5577 (15%) | 21590 (13%) | 30305 (11%) |
10-19 Yrs | 4677 (13%) | 19683 (12%) | 32885 (12%) | |
20-29 Yrs | 5234 (14%) | 22867 (14%) | 37454 (14%) | |
30-39 Yrs | 5889 (16%) | 22830 (14%) | 34208 (13%) | |
40-49 Yrs | 5012 (14%) | 20584 (13%) | 31626 (12%) | |
50-59 Yrs | 3969 (11%) | 20466 (13%) | 34957 (13%) | |
60-69 Yrs | 3269 (9%) | 15237 (9%) | 28399 (11%) | |
70+ Yrs | 2025 (5%) | 11643 (7%) | 23374 (9%) | |
Median HH Income | $35,038 | $50,438 | $64,952 | |
Total Household Income | < 24K | 4609 (38%) | 15036 (27%) | 18909 (20%) |
25-49K | 2844 (23%) | 12118 (22%) | 17426 (19%) | |
50-74K | 1899 (15%) | 9733 (17%) | 14884 (16%) | |
75-99K | 1085 (9%) | 6196 (11%) | 11692 (12%) | |
100-199K | 1300 (10%) | 9508 (17%) | 21451 (23%) | |
200K+ | 217 (1%) | 2082 (3%) | 6199 (6%) | |
Highest Education Level | No Diploma | 7109 | 20952 | 25035 |
Diploma or GED | 8225 | 34974 | 53594 | |
Some College | 4415 | 20740 | 32908 | |
Assoc. Degree | 858 | 5783 | 10682 | |
Bachelors Degree | 1229 | 12208 | 28267 | |
Higher Degree | 798 | 7310 | 19284 | |
Total Housing Units | 15,426 | 63,936 | 102,876 | |
--Owner-Occupied | 3,784 | 25,905 | 52,995 | |
--Renter-Occupied | 8,171 | 28,767 | 37,565 | |
Owner-Occupied Values | < 100K | 2354 | 6671 | 8525 |
100-199K | 1156 | 9913 | 14333 | |
200-299K | 123 | 5675 | 15678 | |
300-399K | 50 | 2040 | 8249 | |
400-499K | 33 | 666 | 3327 | |
500K+ | 68 | 940 | 2883 | |
Total Working Age Population | 27,357 | 121,487 | 204,872 | |
In Work Force | 16,683 | 77,578 | 131,428 | |
Not In Work Force | 10,674 | 43,908 | 73,445 | |
Workforce Employed | 14,818 | 70,444 | 121,428 | |
Workforce Unemployed | 1,860 | 7,011 | 9,835 | |
Civlian Workforce | 16,679 | 77,454 | 131,263 | |
Military Workforce | 4 | 124 | 164 | |
Total Households | 11,954 | 54,672 | 90,560 | |
Family Households | 6,985 | 33,574 | 57,327 | |
Non-Family Households | 4,969 | 21,098 | 33,233 | |
Married Couple | 3,333 | 18,793 | 37,173 | |
Other Family | 3,652 | 14,781 | 20,154 | |
Married w/Child | 1,607 | 7,856 | 14,438 | |
Single Male w/Child | 258 | 1,286 | 1,712 | |
Single Female w/Child | 1,726 | 6,373 | 7,796 |
Population Change Last Two Decades - Plus Projection
2000 | % | 2010 | % | 2020 | % | 2030 | |
---|---|---|---|---|---|---|---|
New Jersey | 8,414,350 | +4 | 8,791,894 | +4 | 9,132,700 | +4 | 9,530,900 |
Burlington County | 423,394 | +6 | 448,734 | 0 | 450,000 | +3 | 464,900 |
Mercer County | 350,761 | +4 | 366,513 | +3 | 379,000 | +5 | 397,400 |
Pennsylvania | 12,281,054 | +3 | 12,702,379 | +4 | 13,230,170 | +4 | 13,759,594 |
Bucks County | 597,635 | +5 | 625,249 | +1 | 629,420 | +1 | 637,730 |
Total Working Age Population:
Total Households:
Total Working Age Population:
Total Households:
Total Working Age Population:
Total Households: