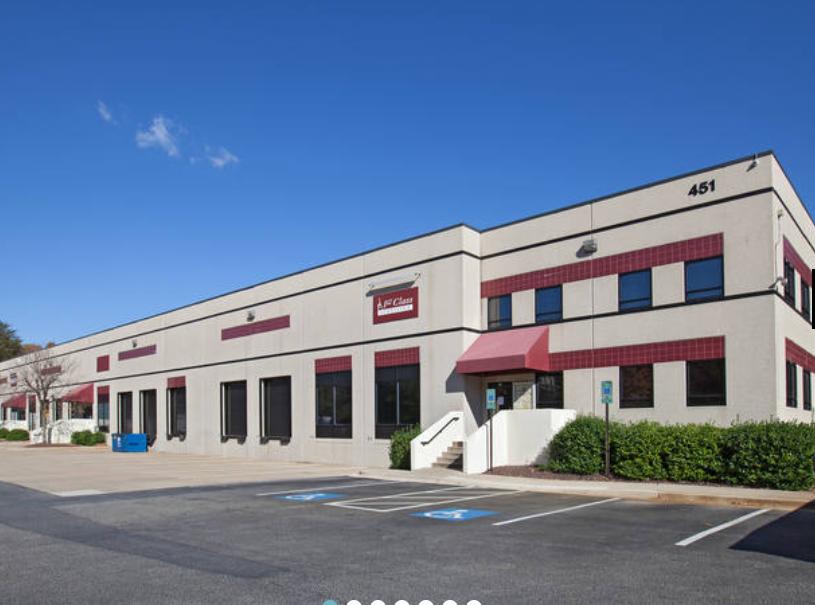
Office Space
451 Defense Highway Annapolis, MD 21401
451 Defense Highway Annapolis, MD 21401
Details & Description
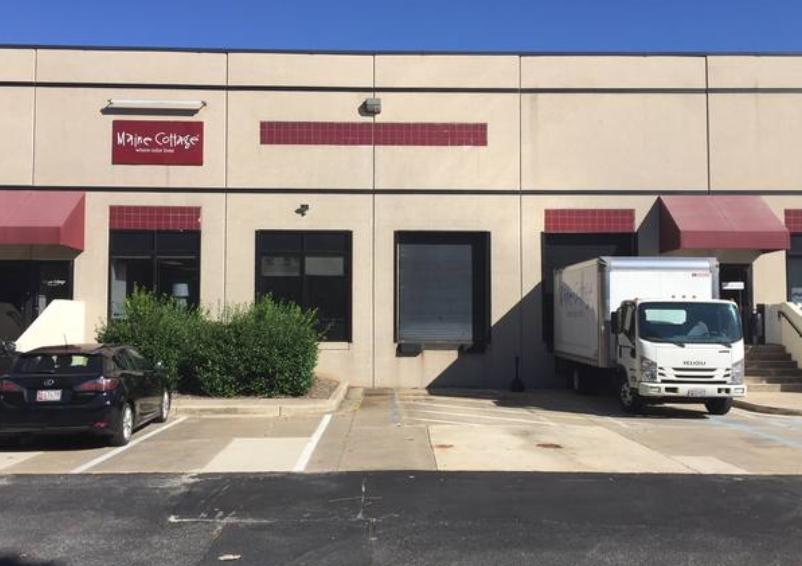
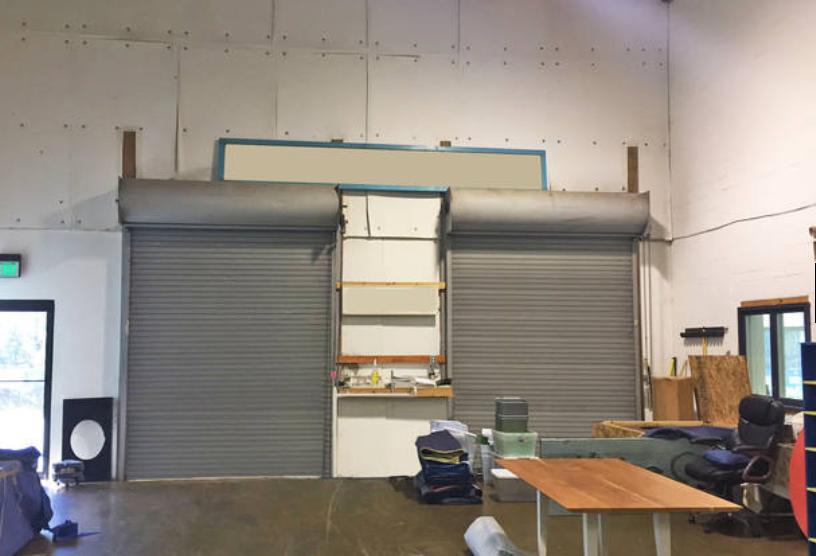
Additional Photos

Listing Agents

Brad Berzins
O: 443-632-2048
M: 813-895-1651
brad.berzins@jll.com
O: 443-632-2048
M: 813-895-1651
brad.berzins@jll.com

Craig Morrell
O: 443-574-1425
cmorrell@klnb.com
O: 443-574-1425
cmorrell@klnb.com

Michael Moran
O: 443-574-1402
M: 410-952-1707
mmoran@klnb.com
O: 443-574-1402
M: 410-952-1707
mmoran@klnb.com
While we strive to provide the most accurate information, all listing information, and demographic data, is provided by third-parties. As such, MyEListing will not be responsible for the accuracy of the information. It is strongly recommended that you verify all information with the listing agent, and any relevant agencies, prior to making any decisions.


