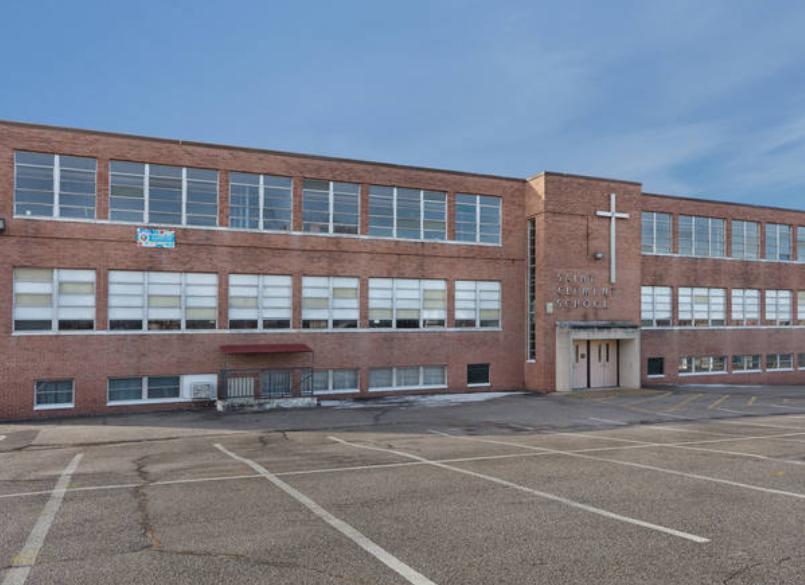
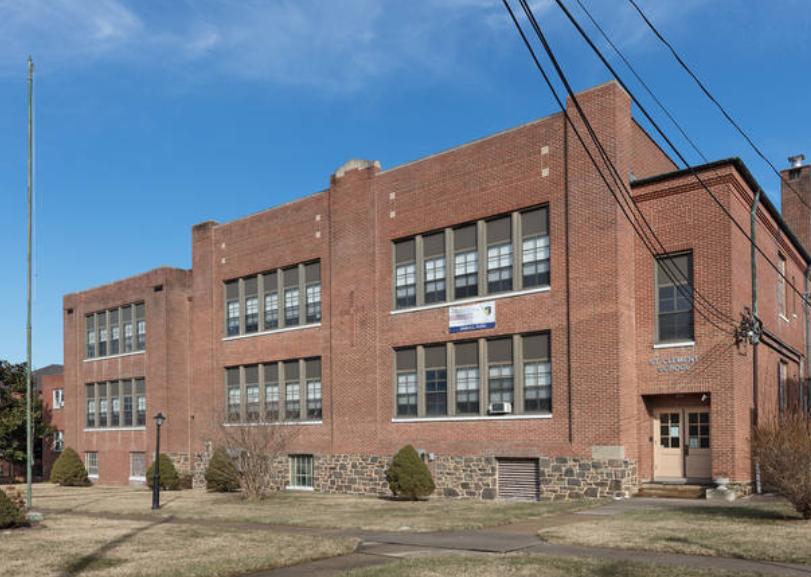
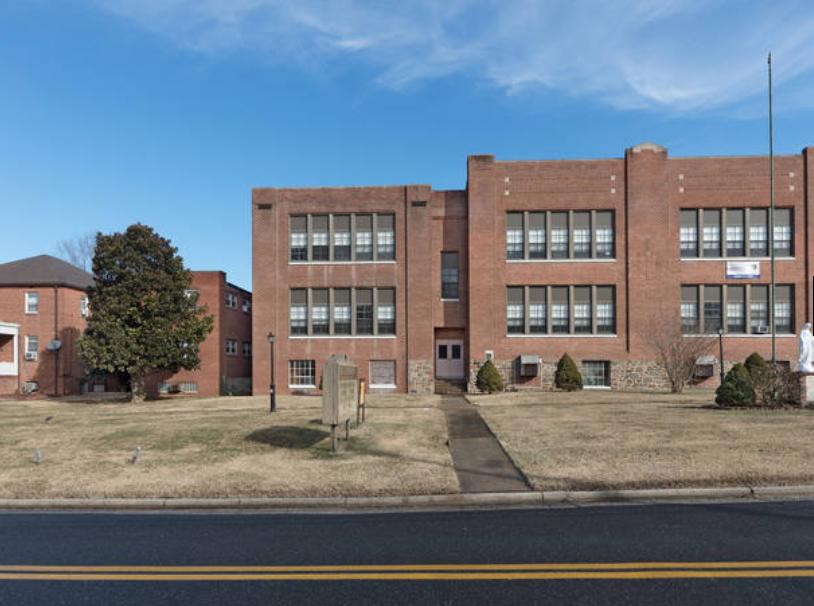
1-Mile | 3-Miles | 5-Miles | ||
---|---|---|---|---|
Total Population | 9,398 | 122,869 | 431,149 | |
Population Median Age | 40 | 39 | 38 | |
Population by Age | 0-9 Yrs | 1162 (12%) | 16394 (13%) | 57282 (13%) |
10-19 Yrs | 1306 (13%) | 14452 (11%) | 48951 (11%) | |
20-29 Yrs | 1022 (10%) | 15887 (12%) | 65420 (15%) | |
30-39 Yrs | 1311 (13%) | 17392 (14%) | 66235 (15%) | |
40-49 Yrs | 863 (9%) | 14902 (12%) | 50404 (11%) | |
50-59 Yrs | 1273 (13%) | 16828 (13%) | 56058 (13%) | |
60-69 Yrs | 1206 (12%) | 15014 (12%) | 47609 (11%) | |
70+ Yrs | 1255 (13%) | 12000 (9%) | 39191 (9%) | |
Median HH Income | $64,826 | $56,827 | $59,161 | |
Total Household Income | < 24K | 516 (15%) | 8763 (19%) | 32729 (19%) |
25-49K | 727 (21%) | 10984 (24%) | 36070 (22%) | |
50-74K | 630 (18%) | 8603 (19%) | 30393 (18%) | |
75-99K | 512 (15%) | 6857 (15%) | 21321 (13%) | |
100-199K | 818 (24%) | 8600 (19%) | 35308 (21%) | |
200K+ | 117 (3%) | 1212 (2%) | 7933 (4%) | |
Highest Education Level | No Diploma | 728 | 12700 | 41408 |
Diploma or GED | 2268 | 32018 | 97985 | |
Some College | 1500 | 19070 | 60622 | |
Assoc. Degree | 388 | 4973 | 17422 | |
Bachelors Degree | 1009 | 10127 | 46798 | |
Higher Degree | 573 | 6203 | 33860 | |
Total Housing Units | 3,537 | 50,097 | 188,113 | |
--Owner-Occupied | 2,524 | 28,621 | 94,404 | |
--Renter-Occupied | 796 | 16,399 | 69,350 | |
Owner-Occupied Values | < 100K | 173 | 4911 | 14237 |
100-199K | 1006 | 14658 | 42567 | |
200-299K | 1135 | 7235 | 24267 | |
300-399K | 108 | 1121 | 7403 | |
400-499K | 17 | 332 | 2916 | |
500K+ | 86 | 364 | 3015 | |
Total Working Age Population | 7,522 | 97,322 | 344,003 | |
In Work Force | 4,693 | 62,692 | 226,108 | |
Not In Work Force | 2,830 | 34,631 | 117,895 | |
Workforce Employed | 4,457 | 58,784 | 210,545 | |
Workforce Unemployed | 236 | 3,705 | 15,027 | |
Civlian Workforce | 4,693 | 62,489 | 225,572 | |
Military Workforce | 0 | 202 | 536 | |
Total Households | 3,320 | 45,019 | 163,754 | |
Family Households | 2,378 | 28,269 | 95,613 | |
Non-Family Households | 942 | 16,750 | 68,141 | |
Married Couple | 1,574 | 15,950 | 55,156 | |
Other Family | 804 | 12,319 | 40,457 | |
Married w/Child | 562 | 5,697 | 20,140 | |
Single Male w/Child | 46 | 1,059 | 4,355 | |
Single Female w/Child | 286 | 4,641 | 15,217 |
Population Change Last Two Decades - Plus Projection
2000 | % | 2010 | % | 2020 | % | 2030 | |
---|---|---|---|---|---|---|---|
Maryland | 5,296,486 | +9 | 5,773,552 | +6 | 6,141,900 | +6 | 6,518,750 |
Baltimore County | 754,292 | +7 | 805,029 | +5 | 847,000 | +2 | 862,200 |
Harford County | 218,590 | +12 | 244,826 | +5 | 257,700 | +5 | 271,850 |
Baltimore city | 651,154 | -5 | 620,961 | -1 | 616,300 | +1 | 625,100 |
Total Working Age Population:
Total Households:
Total Working Age Population:
Total Households:
Total Working Age Population:
Total Households: