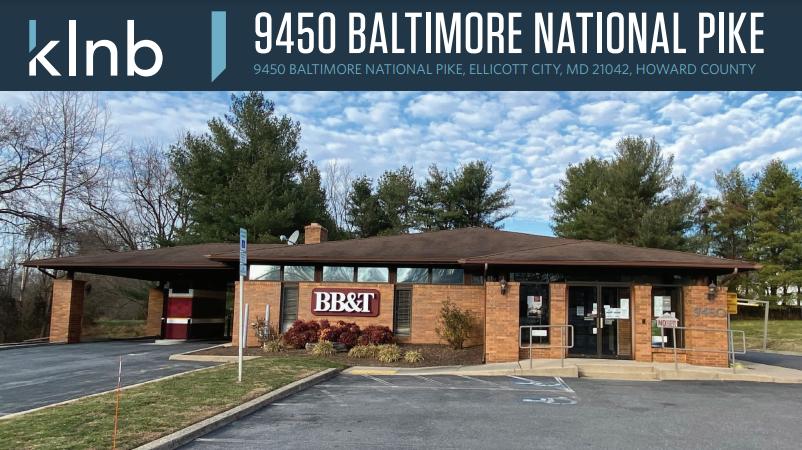
2,414 SF Free Standing BB&T + Basement - Available March 2021
Lot size is 0.87 acres [37,984 SF]
2 Existing drive thru lanes
17 Parking spaces on site
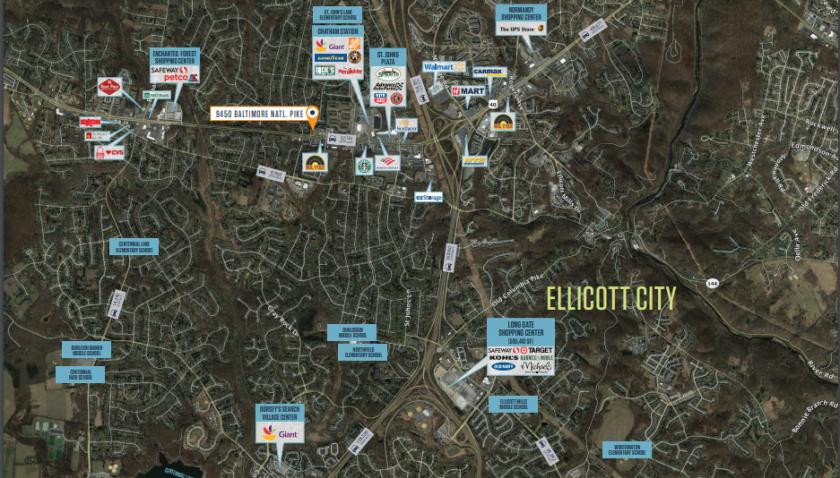
Surrounded by an affluent residential base in highly desirable Howard County, MD
Zoned B-2 (Business: General) District which permits a wide variety of uses including financial services, fast food/fast casual/QSR restaurants, service retail, automotive, pet services, and medical office/clinics.
Pylon signage on highly trafficked Baltimore National Pike [Route 40] which carries over 57,000 vehicles per day.
No part of this information may be copied, reproduced, repurposed, or screen-captured for any commercial purpose without prior written authorization from MyEListing.
While we strive to provide the most accurate information, all listing information, and demographic data, is provided by third-parties. As such, MyEListing will not be responsible for the accuracy of the information. It is strongly recommended that you verify all information with the listing agent, and any relevant agencies, prior to making any decisions.
What is the building size of this commercial Retail property?
The size of this lease property at '.9450 Baltimore National Pike.' is 2414 square feet
What kind of Retail is the propery at 9450 Baltimore National Pike?
The property at 9450 Baltimore National Pike Ellicott City, MD 21042 is listed as a Other Retail Retail property
What is the population within 1 mile of 9450 Baltimore National Pike in Ellicott City?
The population within 1 mile of 9450 Baltimore National Pike Ellicott City, MD 21042 is 9,681 people.
Who do I contact for questions about 9450 Baltimore National Pike?
You should contact the listing agent,
Ryan Wilner, for any details regarding this commercial listing.