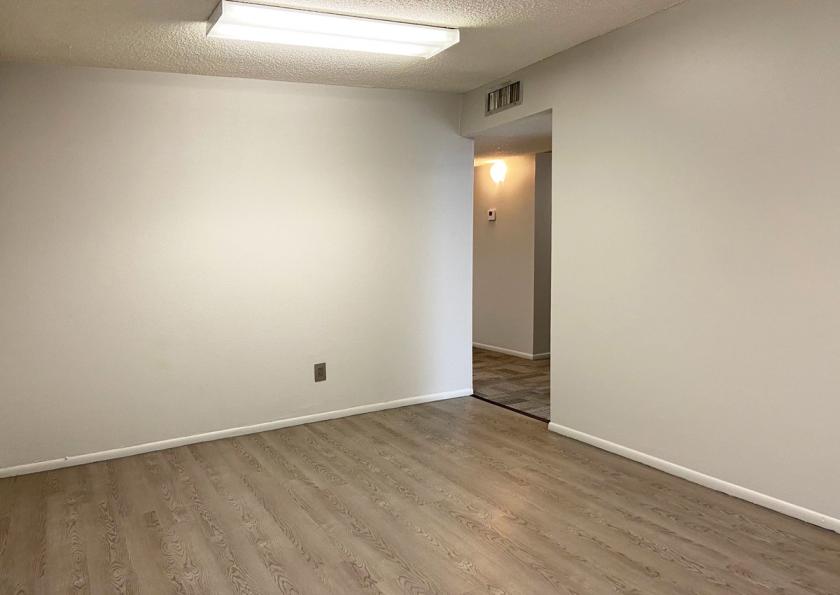
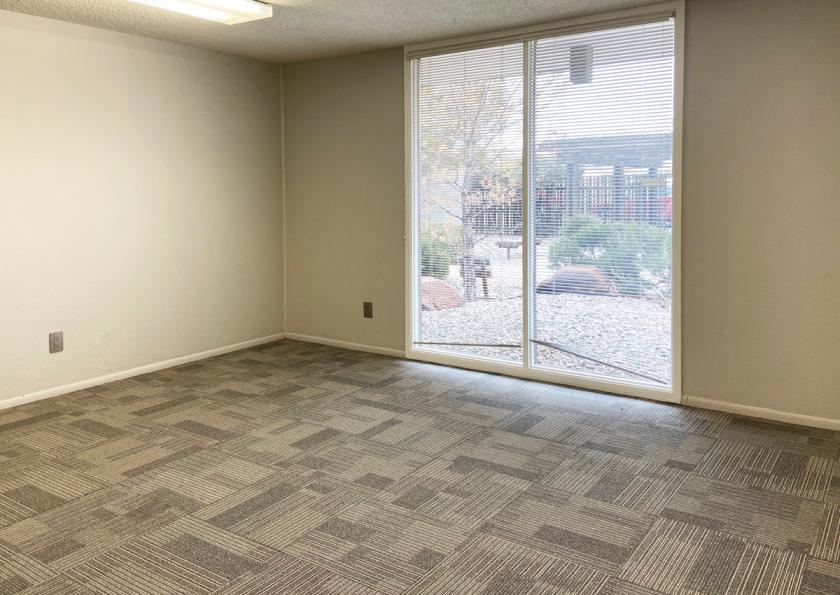
Office Space
4015 Carlisle Boulevard Northeast Albuquerque, NM 87107
4015 Carlisle Boulevard Northeast Albuquerque, NM 87107
Details & Description
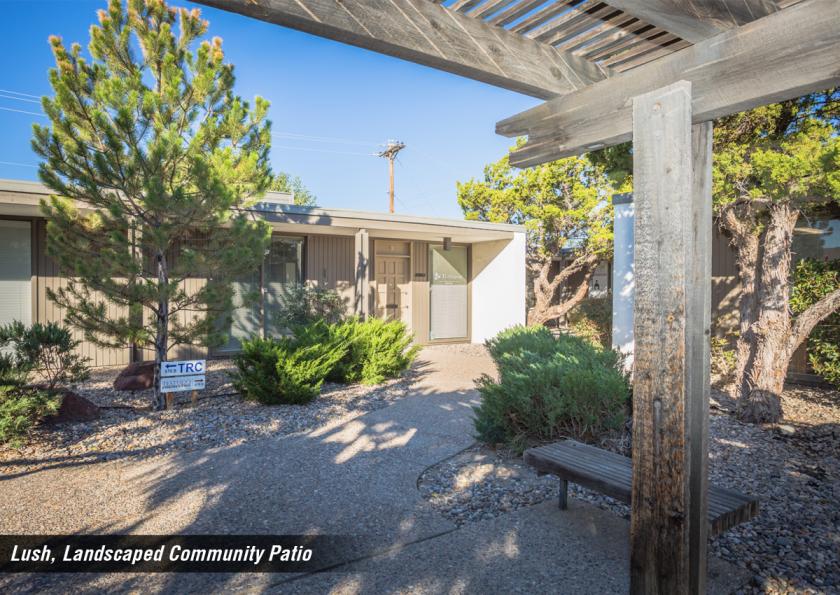
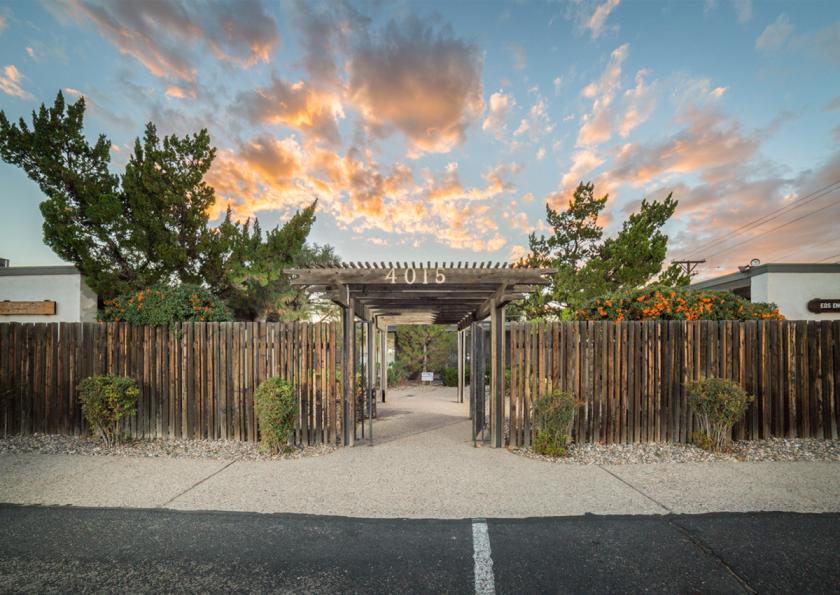
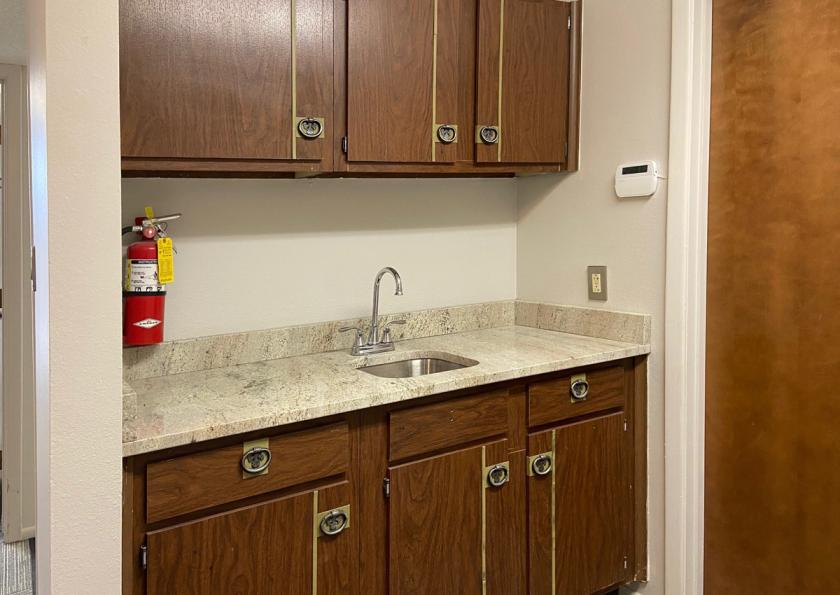
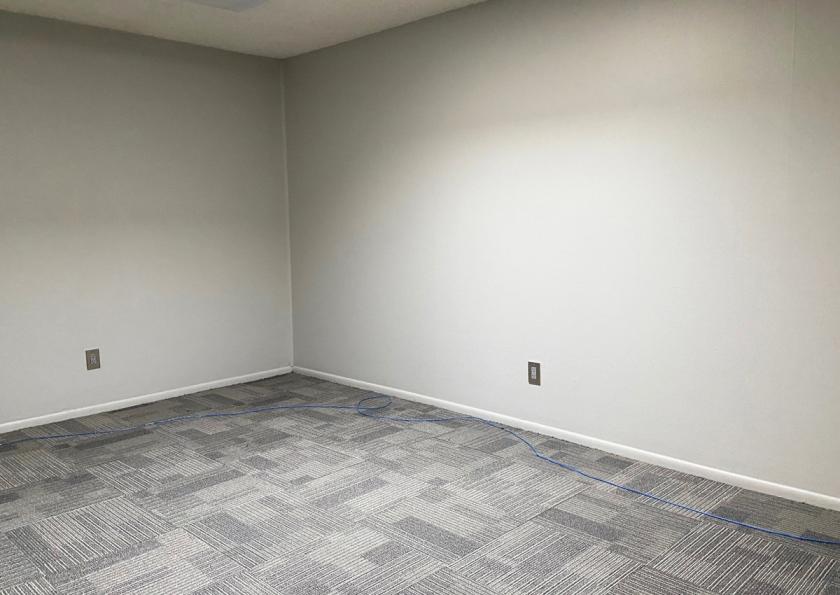
Additional Photos
Listing Agents

Shelly Branscom
O: 505-998-5737
M: 505-414-2669
shelly@sunvista.com
O: 505-998-5737
M: 505-414-2669
shelly@sunvista.com
While we strive to provide the most accurate information, all listing information, and demographic data, is provided by third-parties. As such, MyEListing will not be responsible for the accuracy of the information. It is strongly recommended that you verify all information with the listing agent, and any relevant agencies, prior to making any decisions.