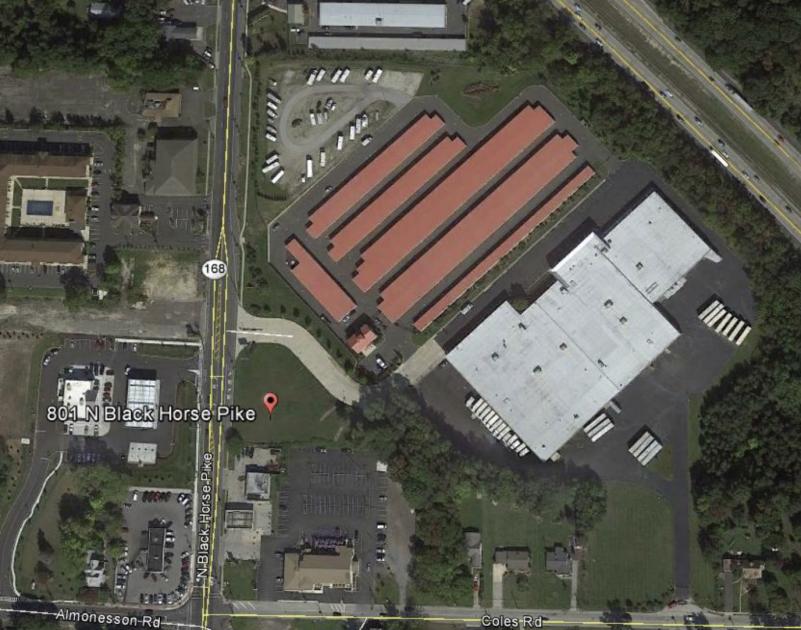
1-Mile | 3-Miles | 5-Miles | ||
---|---|---|---|---|
Total Population | 9,061 | 76,359 | 222,649 | |
Population Median Age | 40 | 40 | 40 | |
Population by Age | 0-9 Yrs | 978 (10%) | 8866 (11%) | 25591 (11%) |
10-19 Yrs | 932 (10%) | 8287 (10%) | 24678 (11%) | |
20-29 Yrs | 1398 (15%) | 11000 (14%) | 31943 (14%) | |
30-39 Yrs | 1238 (13%) | 10093 (13%) | 29278 (13%) | |
40-49 Yrs | 998 (11%) | 9362 (12%) | 28728 (12%) | |
50-59 Yrs | 1337 (14%) | 10792 (14%) | 31332 (14%) | |
60-69 Yrs | 1303 (14%) | 9532 (12%) | 27310 (12%) | |
70+ Yrs | 876 (9%) | 8427 (11%) | 23790 (10%) | |
Median HH Income | $68,437 | $72,203 | $71,677 | |
Total Household Income | < 24K | 550 (15%) | 4217 (14%) | 13604 (15%) |
25-49K | 771 (21%) | 5981 (20%) | 16850 (19%) | |
50-74K | 685 (18%) | 5137 (17%) | 14647 (16%) | |
75-99K | 504 (13%) | 4156 (14%) | 12294 (14%) | |
100-199K | 903 (24%) | 8037 (27%) | 23141 (26%) | |
200K+ | 254 (6%) | 2040 (6%) | 6001 (6%) | |
Highest Education Level | No Diploma | 665 | 4419 | 13066 |
Diploma or GED | 2101 | 17792 | 52631 | |
Some College | 1294 | 11223 | 32560 | |
Assoc. Degree | 758 | 4887 | 12757 | |
Bachelors Degree | 1146 | 11063 | 31712 | |
Higher Degree | 544 | 4743 | 15084 | |
Total Housing Units | 3,980 | 31,788 | 93,452 | |
--Owner-Occupied | 2,456 | 20,188 | 57,658 | |
--Renter-Occupied | 1,210 | 9,381 | 28,879 | |
Owner-Occupied Values | < 100K | 129 | 1466 | 4068 |
100-199K | 1421 | 9456 | 27778 | |
200-299K | 735 | 7078 | 18837 | |
300-399K | 66 | 1604 | 4703 | |
400-499K | 32 | 226 | 1064 | |
500K+ | 74 | 357 | 1209 | |
Total Working Age Population | 7,502 | 62,251 | 181,500 | |
In Work Force | 5,160 | 42,827 | 123,975 | |
Not In Work Force | 2,342 | 19,424 | 57,525 | |
Workforce Employed | 4,851 | 40,348 | 116,322 | |
Workforce Unemployed | 308 | 2,463 | 7,600 | |
Civlian Workforce | 5,160 | 42,811 | 123,921 | |
Military Workforce | 0 | 16 | 54 | |
Total Households | 3,666 | 29,568 | 86,537 | |
Family Households | 2,286 | 19,419 | 55,724 | |
Non-Family Households | 1,380 | 10,150 | 30,813 | |
Married Couple | 1,585 | 13,904 | 39,037 | |
Other Family | 701 | 5,515 | 16,686 | |
Married w/Child | 486 | 5,269 | 14,707 | |
Single Male w/Child | 99 | 632 | 2,025 | |
Single Female w/Child | 255 | 1,769 | 5,854 |
Population Change Last Two Decades - Plus Projection
2000 | % | 2010 | % | 2020 | % | 2030 | |
---|---|---|---|---|---|---|---|
New Jersey | 8,414,350 | +4 | 8,791,894 | +4 | 9,132,700 | +4 | 9,530,900 |
Burlington County | 423,394 | +6 | 448,734 | 0 | 450,000 | +3 | 464,900 |
Camden County | 508,932 | +1 | 513,657 | 0 | 511,800 | +2 | 521,000 |
Gloucester County | 254,673 | +13 | 288,288 | +1 | 292,000 | +5 | 305,800 |
Salem County | 64,285 | +3 | 66,083 | -5 | 63,000 | -3 | 61,000 |
Pennsylvania | 12,281,054 | +3 | 12,702,379 | +4 | 13,230,170 | +4 | 13,759,594 |
Philadelphia County | 1,517,550 | +1 | 1,526,006 | +8 | 1,653,729 | +6 | 1,753,054 |
Total Working Age Population:
Total Households:
Total Working Age Population:
Total Households:
Total Working Age Population:
Total Households: