10,649 sq. ft. divisible office space available for sublease
Space located on first floor of of well maintained three story office building
Current space layout features 11 private offices, conference room, kitchen and open bullpen area with ±50 cubicles. Space is move-in ready and can be delivered with furniture in place.
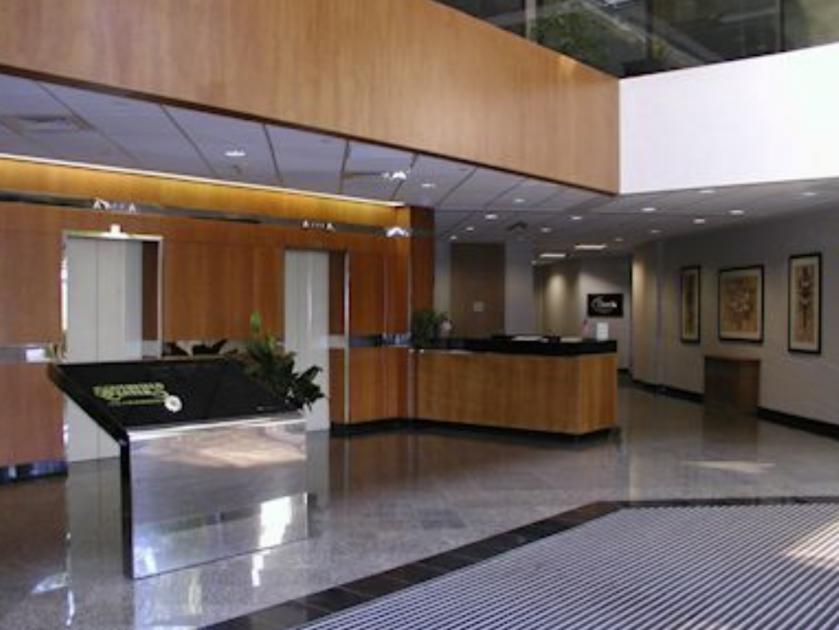
Building features include three story atrium and security attended lobby with marble and granite finishes
On-site property management
On-site day-care center
Ample parking available
Conveniently located just minutes from I-287 and the NJ Turnpike Area amenities include local shopping, banking, restaurants and hotel accommodations.
No part of this information may be copied, reproduced, repurposed, or screen-captured for any commercial purpose without prior written authorization from MyEListing.
While we strive to provide the most accurate information, all listing information, and demographic data, is provided by third-parties. As such, MyEListing will not be responsible for the accuracy of the information. It is strongly recommended that you verify all information with the listing agent, and any relevant agencies, prior to making any decisions.
What is the building size of this commercial Office property?
The size of this lease property at '.1 Cragwood Road.' is 10649 square feet
What kind of Office is the propery at 1 Cragwood Road?
The property at 1 Cragwood Road South Plainfield, NJ 07080 is listed as a Professional Office property
What is the population within 1 mile of 1 Cragwood Road in South Plainfield?
The population within 1 mile of 1 Cragwood Road South Plainfield, NJ 07080 is 6,556 people.
Who do I contact for questions about 1 Cragwood Road?
You should contact the listing agent,
Marc Shein, for any details regarding this commercial listing.