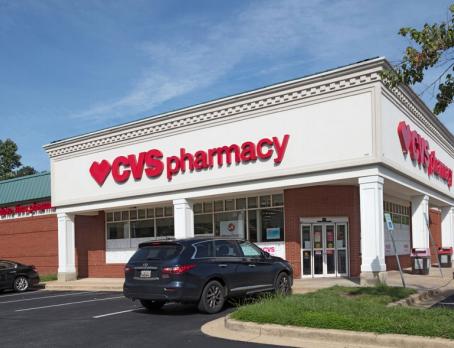
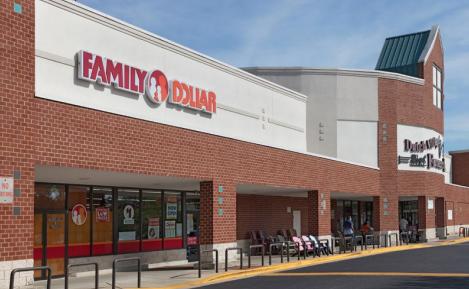
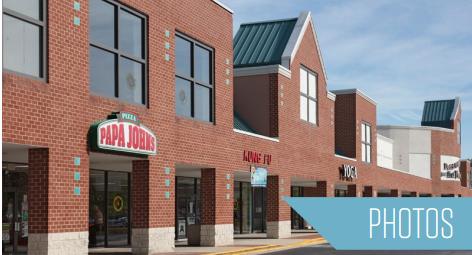
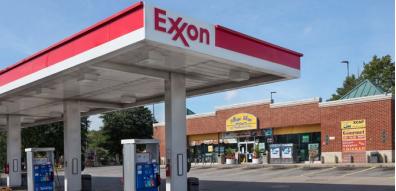
1-Mile | 3-Miles | 5-Miles | ||
---|---|---|---|---|
Total Population | 7,357 | 25,656 | 62,886 | |
Population Median Age | 36 | 38 | 39 | |
Population by Age | 0-9 Yrs | 660 (8%) | 2985 (11%) | 7042 (11%) |
10-19 Yrs | 1176 (15%) | 3556 (13%) | 8002 (12%) | |
20-29 Yrs | 1029 (13%) | 3052 (11%) | 7376 (11%) | |
30-39 Yrs | 1316 (17%) | 3732 (14%) | 8125 (12%) | |
40-49 Yrs | 1232 (16%) | 4183 (16%) | 9309 (14%) | |
50-59 Yrs | 1099 (14%) | 4136 (16%) | 10824 (17%) | |
60-69 Yrs | 456 (6%) | 2343 (9%) | 7276 (11%) | |
70+ Yrs | 390 (5%) | 1669 (6%) | 4931 (7%) | |
Median HH Income | $99,439 | $120,493 | $115,013 | |
Total Household Income | < 24K | 171 (6%) | 536 (5%) | 1587 (6%) |
25-49K | 243 (8%) | 704 (7%) | 2135 (9%) | |
50-74K | 439 (15%) | 918 (10%) | 2531 (11%) | |
75-99K | 582 (20%) | 1426 (15%) | 3264 (14%) | |
100-199K | 1072 (37%) | 3826 (41%) | 9193 (40%) | |
200K+ | 338 (11%) | 1768 (19%) | 4003 (17%) | |
Highest Education Level | No Diploma | 224 | 908 | 2336 |
Diploma or GED | 1398 | 3687 | 9974 | |
Some College | 1287 | 4127 | 10289 | |
Assoc. Degree | 303 | 1141 | 2808 | |
Bachelors Degree | 1066 | 4312 | 10220 | |
Higher Degree | 749 | 3523 | 8548 | |
Total Housing Units | 3,175 | 9,826 | 23,713 | |
--Owner-Occupied | 1,888 | 7,716 | 19,740 | |
--Renter-Occupied | 958 | 1,462 | 2,972 | |
Owner-Occupied Values | < 100K | 20 | 241 | 1107 |
100-199K | 459 | 848 | 1749 | |
200-299K | 896 | 2086 | 4898 | |
300-399K | 342 | 1798 | 5156 | |
400-499K | 85 | 1388 | 3681 | |
500K+ | 86 | 1354 | 3149 | |
Total Working Age Population | 6,113 | 20,711 | 51,185 | |
In Work Force | 4,298 | 14,737 | 35,813 | |
Not In Work Force | 1,815 | 5,973 | 15,372 | |
Workforce Employed | 4,070 | 14,046 | 34,116 | |
Workforce Unemployed | 189 | 535 | 1,400 | |
Civlian Workforce | 4,259 | 14,581 | 35,516 | |
Military Workforce | 38 | 156 | 296 | |
Total Households | 2,846 | 9,178 | 22,713 | |
Family Households | 1,640 | 6,193 | 15,682 | |
Non-Family Households | 1,206 | 2,985 | 7,031 | |
Married Couple | 863 | 4,195 | 10,796 | |
Other Family | 777 | 1,998 | 4,885 | |
Married w/Child | 418 | 1,954 | 4,395 | |
Single Male w/Child | 77 | 222 | 457 | |
Single Female w/Child | 265 | 633 | 1,454 |
Population Change Last Two Decades - Plus Projection
2000 | % | 2010 | % | 2020 | % | 2030 | |
---|---|---|---|---|---|---|---|
Maryland | 5,296,486 | +9 | 5,773,552 | +6 | 6,141,900 | +6 | 6,518,750 |
Anne Arundel County | 489,656 | +10 | 537,656 | +7 | 573,250 | +4 | 596,700 |
Calvert County | 74,563 | +19 | 88,737 | +7 | 94,600 | +5 | 99,200 |
Prince Georges County | 801,515 | +8 | 863,420 | +6 | 916,150 | +4 | 952,950 |
Total Working Age Population:
Total Households:
Total Working Age Population:
Total Households:
Total Working Age Population:
Total Households: