Total Building Size: 16,710 SF
Available:
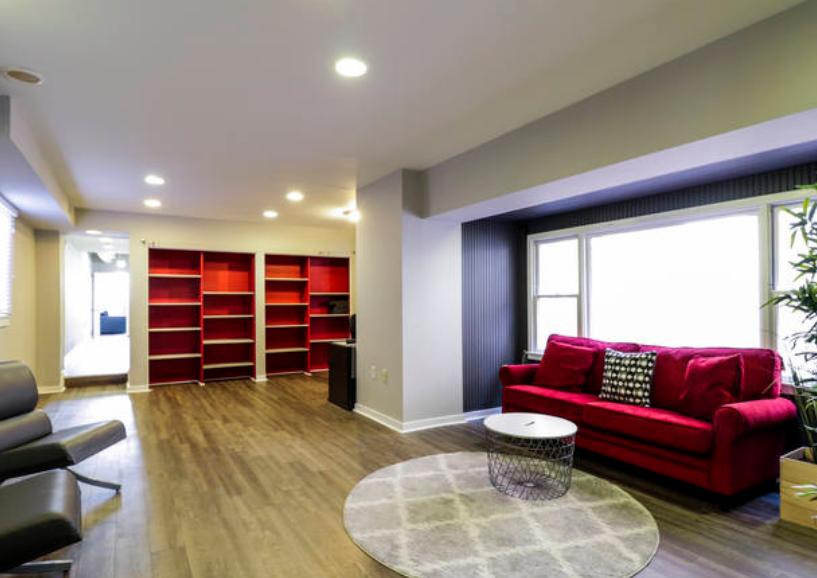
1,000 SF - Suite 360 in 521 N. Charles Street
Available Now!
2,800 SF - Suite 200 in 519 N. Charles Street
Available Now
Lease Term: Flexible options
Rental Rate: Negotiable
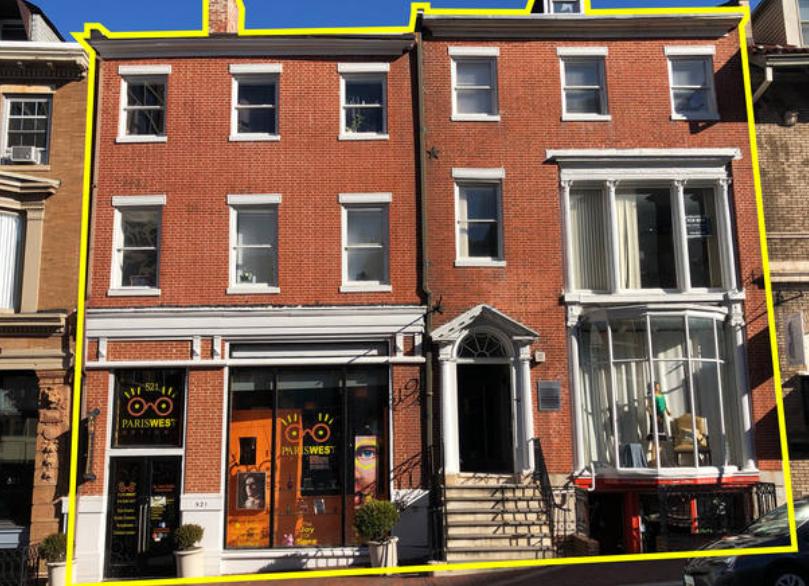
Location: Conveniently located in Mt. Vernon
All Suites: Very desirable and creative spaces perfect for designers, architects and artists
Property Highlights For Sale:
Total Building Size: 16,710 SF
Available:
1,000 SF - Suite 360 in 521 N. Charles Street
Available Now!
2,800 SF - Suite 200 in 519 N. Charles Street
Available Now
Lease Term: Flexible options
Purchase Price: $1,850,000
Location: Conveniently located in Mt. Vernon
All Suites: Very desirable and creative spaces perfect for designers, architects and artists
No part of this information may be copied, reproduced, repurposed, or screen-captured for any commercial purpose without prior written authorization from MyEListing.
While we strive to provide the most accurate information, all listing information, and demographic data, is provided by third-parties. As such, MyEListing will not be responsible for the accuracy of the information. It is strongly recommended that you verify all information with the listing agent, and any relevant agencies, prior to making any decisions.
What is the asking price for 519 North Charles Street in Baltimore?
The asking price for 519 North Charles Street is $1,850,000
What is the building size of this Office property in Baltimore, MD?
The size of the building/unit at 519 North Charles Street in Baltimore is 16,710 square feet
What kind of Office is the propery at 519 North Charles Street?
The property at 519 North Charles Street Baltimore, MD 21201 is listed as a Professional Office property
What is the population within 1 mile of 519 North Charles Street in Baltimore?
The population within 1 mile of 519 North Charles Street Baltimore, MD 21201 is 43,611 people.
Who do I contact for questions about 519 North Charles Street?
You should contact the listing agent,
Jesse Schwartzman, for any details regarding this commercial listing.