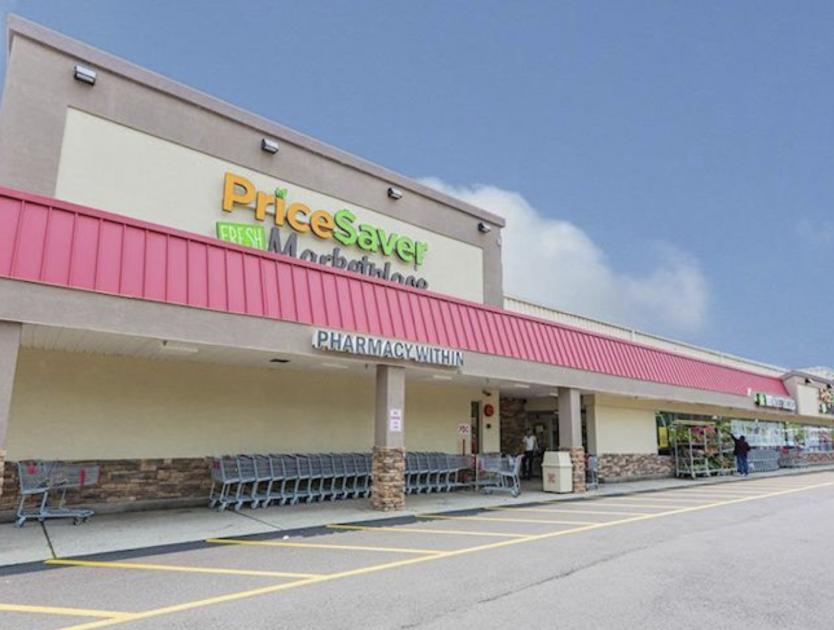
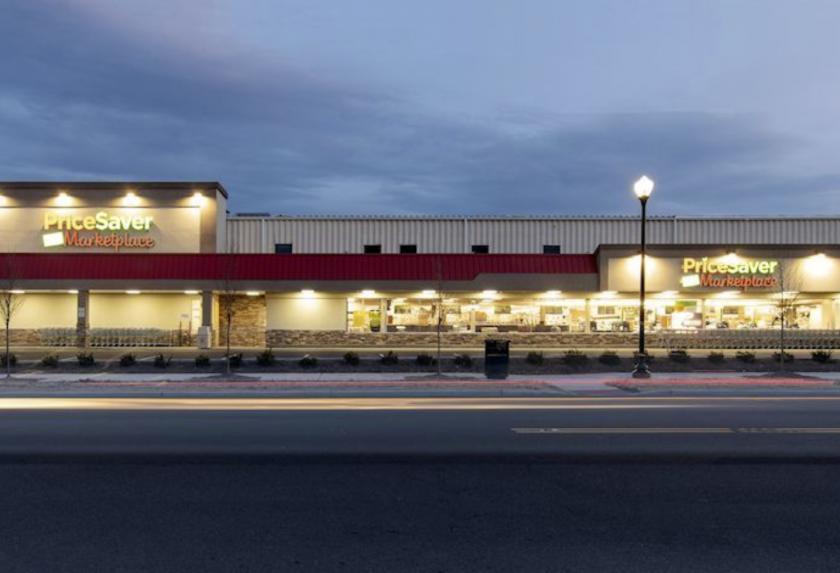
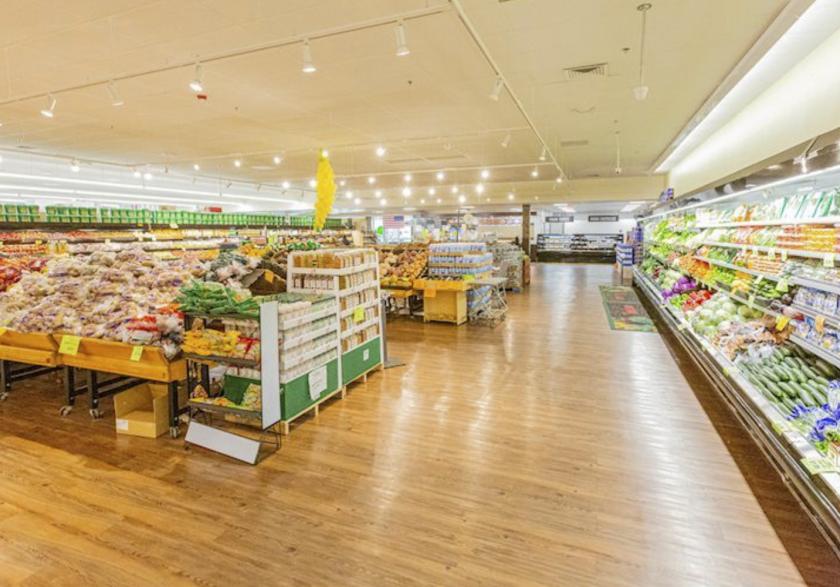
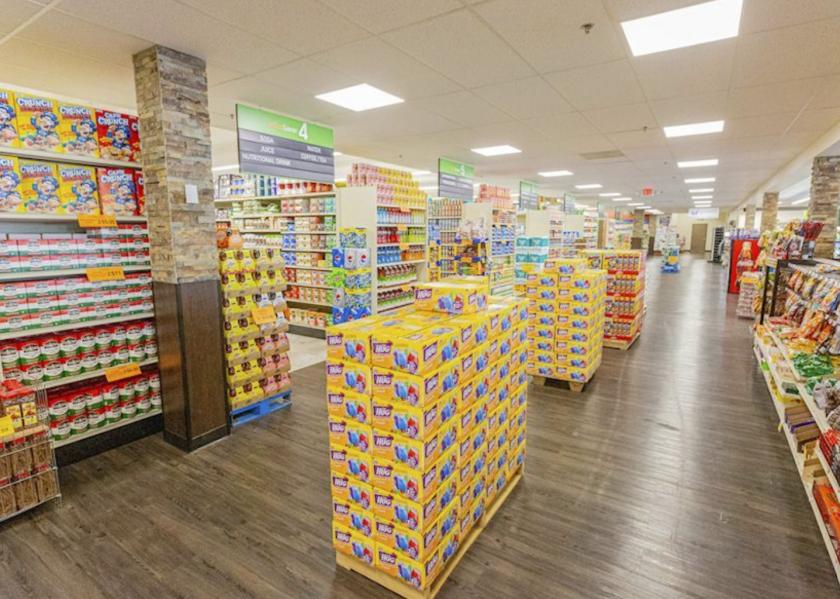
1-Mile | 3-Miles | 5-Miles | ||
---|---|---|---|---|
Total Population | 11,524 | 70,564 | 193,128 | |
Population Median Age | 37 | 39 | 39 | |
Population by Age | 0-9 Yrs | 1617 (14%) | 8562 (12%) | 21064 (10%) |
10-19 Yrs | 1504 (13%) | 8621 (12%) | 25903 (13%) | |
20-29 Yrs | 1374 (11%) | 8695 (12%) | 29541 (15%) | |
30-39 Yrs | 1915 (16%) | 10003 (14%) | 26701 (13%) | |
40-49 Yrs | 1262 (10%) | 9275 (13%) | 23987 (12%) | |
50-59 Yrs | 1840 (15%) | 10423 (14%) | 26454 (13%) | |
60-69 Yrs | 1160 (10%) | 7470 (10%) | 20018 (10%) | |
70+ Yrs | 853 (7%) | 7516 (10%) | 19459 (10%) | |
Median HH Income | $87,292 | $91,191 | $92,031 | |
Total Household Income | < 24K | 324 (8%) | 2302 (9%) | 6914 (10%) |
25-49K | 814 (20%) | 3985 (16%) | 9392 (14%) | |
50-74K | 648 (16%) | 4037 (16%) | 9911 (15%) | |
75-99K | 441 (11%) | 3239 (13%) | 8757 (13%) | |
100-199K | 1381 (34%) | 7910 (31%) | 20536 (31%) | |
200K+ | 399 (9%) | 3371 (13%) | 8857 (13%) | |
Highest Education Level | No Diploma | 665 | 4212 | 10294 |
Diploma or GED | 2454 | 13806 | 33987 | |
Some College | 1567 | 8388 | 21153 | |
Assoc. Degree | 536 | 3418 | 8497 | |
Bachelors Degree | 1665 | 11732 | 32333 | |
Higher Degree | 1051 | 7836 | 22470 | |
Total Housing Units | 4,363 | 26,808 | 69,350 | |
--Owner-Occupied | 2,572 | 17,280 | 44,596 | |
--Renter-Occupied | 1,435 | 7,564 | 19,772 | |
Owner-Occupied Values | < 100K | 38 | 243 | 902 |
100-199K | 37 | 828 | 2479 | |
200-299K | 965 | 5740 | 13946 | |
300-399K | 1073 | 5485 | 13816 | |
400-499K | 308 | 2268 | 5775 | |
500K+ | 151 | 2716 | 7679 | |
Total Working Age Population | 8,903 | 56,388 | 158,537 | |
In Work Force | 6,471 | 39,568 | 102,067 | |
Not In Work Force | 2,431 | 16,820 | 56,470 | |
Workforce Employed | 6,193 | 37,864 | 96,614 | |
Workforce Unemployed | 279 | 1,704 | 5,453 | |
Civlian Workforce | 6,471 | 39,568 | 102,067 | |
Military Workforce | 0 | 0 | 0 | |
Total Households | 4,007 | 24,844 | 64,368 | |
Family Households | 2,946 | 18,440 | 46,792 | |
Non-Family Households | 1,061 | 6,403 | 17,576 | |
Married Couple | 2,301 | 14,122 | 35,587 | |
Other Family | 644 | 4,318 | 11,204 | |
Married w/Child | 1,069 | 5,726 | 14,605 | |
Single Male w/Child | 115 | 656 | 1,304 | |
Single Female w/Child | 155 | 1,239 | 3,473 |
Population Change Last Two Decades - Plus Projection
2000 | % | 2010 | % | 2020 | % | 2030 | |
---|---|---|---|---|---|---|---|
New Jersey | 8,414,350 | +4 | 8,791,894 | +4 | 9,132,700 | +4 | 9,530,900 |
Middlesex County | 750,162 | +8 | 809,858 | +8 | 873,400 | +7 | 932,200 |
Monmouth County | 615,301 | +2 | 630,380 | 0 | 633,400 | +3 | 655,300 |
Somerset County | 297,490 | +9 | 323,444 | +6 | 342,900 | +7 | 366,700 |
Union County | 522,541 | +3 | 536,499 | +7 | 573,000 | +6 | 605,600 |
Total Working Age Population:
Total Households:
Total Working Age Population:
Total Households:
Total Working Age Population:
Total Households: