45,000 SF Class A Building
Located within the Highlands Corporate Office Park – Building 3
Class A office space available
Locally owned and operated
Free surface parking at a ratio of 4:1,000 SF leased
Availability
3rd Floor - Suite 300: ±15,613 SF (full floor)
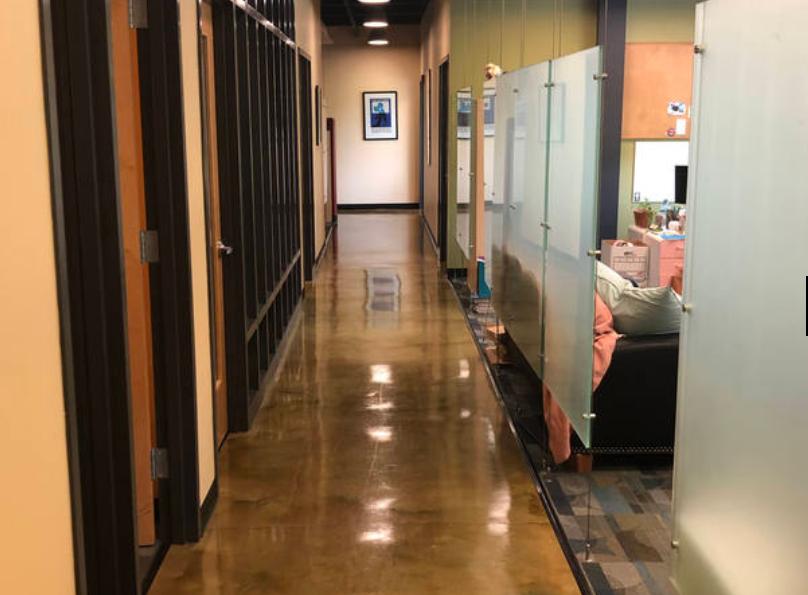
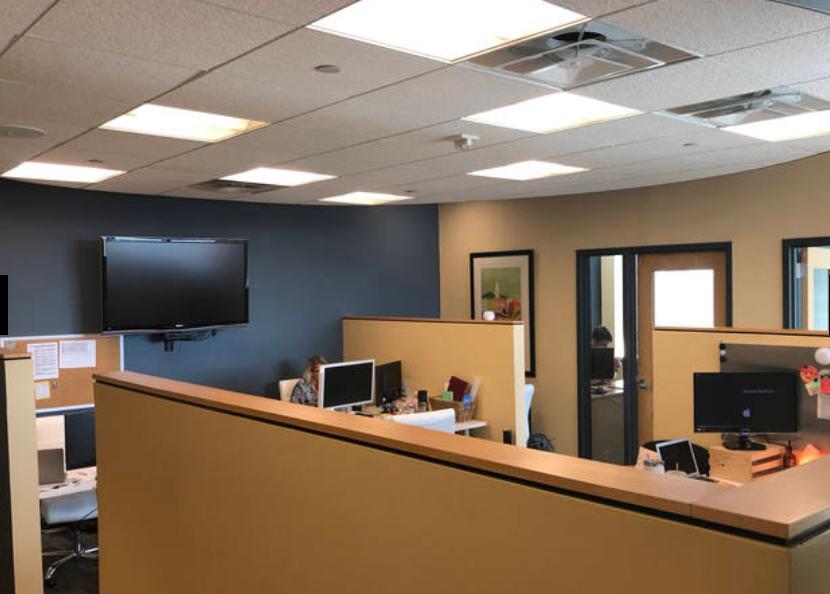
High-end finishes throughout
Private offices and open work areas throughout
Exposed ceilings
No part of this information may be copied, reproduced, repurposed, or screen-captured for any commercial purpose without prior written authorization from MyEListing.
While we strive to provide the most accurate information, all listing information, and demographic data, is provided by third-parties. As such, MyEListing will not be responsible for the accuracy of the information. It is strongly recommended that you verify all information with the listing agent, and any relevant agencies, prior to making any decisions.
What is the building size of this Office property in Sparks Glencoe, MD?
The size of the building/unit at 909 Ridgebrook Road in Sparks Glencoe is 45,000 square feet
What kind of Office is the propery at 909 Ridgebrook Road?
The property at 909 Ridgebrook Road Sparks Glencoe, MD 21152 is listed as a Professional Office property
What is the population within 1 mile of 909 Ridgebrook Road in Sparks Glencoe?
The population within 1 mile of 909 Ridgebrook Road Sparks Glencoe, MD 21152 is 1,598 people.
Who do I contact for questions about 909 Ridgebrook Road?
You should contact the listing agent,
Jesse Schwartzman, for any details regarding this commercial listing.