Investment Opportunity - Fully Tenanted!
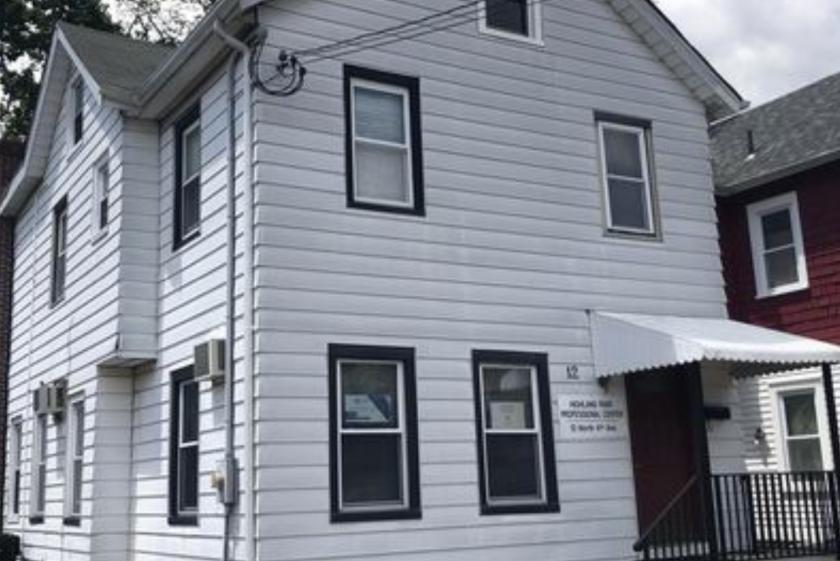
For Sale - 1,738 SF Professional Building
Ideal User/Investment Opportunity
2 Story Office Building with Basement
Stable long-term tenancies
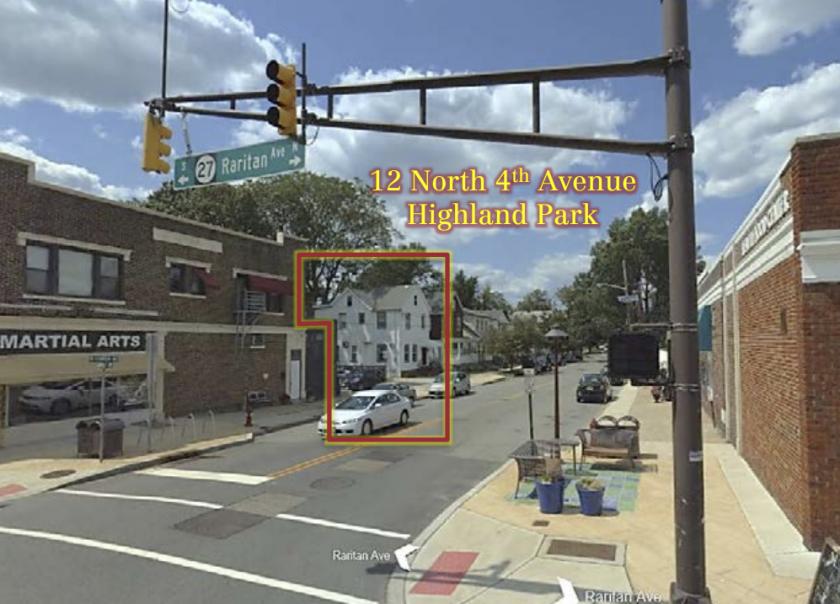
Located off the corner of Route 27 within walking distance to downtown shopping and restaurants
Minutes from downtown New Brunswick, The New Brunswick Train Station, Rutgers University Campus, Middlesex County Courthouses, Robert Wood Johnson Hospital and Saint Peter's University Hospital
Easy access to Route 27, Route 18, Route 1, Route 287 & the NJ Turnpike.
No part of this information may be copied, reproduced, repurposed, or screen-captured for any commercial purpose without prior written authorization from MyEListing.
While we strive to provide the most accurate information, all listing information, and demographic data, is provided by third-parties. As such, MyEListing will not be responsible for the accuracy of the information. It is strongly recommended that you verify all information with the listing agent, and any relevant agencies, prior to making any decisions.
What is the building size of this Office property in Highland Park, NJ?
The size of the building/unit at 12 North 4th Avenue in Highland Park is 1,738 square feet
What kind of Office is the propery at 12 North 4th Avenue?
The property at 12 North 4th Avenue Highland Park, NJ 08904 is listed as a Professional Office property
What is the population within 1 mile of 12 North 4th Avenue in Highland Park?
The population within 1 mile of 12 North 4th Avenue Highland Park, NJ 08904 is 24,030 people.
Who do I contact for questions about 12 North 4th Avenue?
You should contact the listing agent,
Marc Shein, for any details regarding this commercial listing.