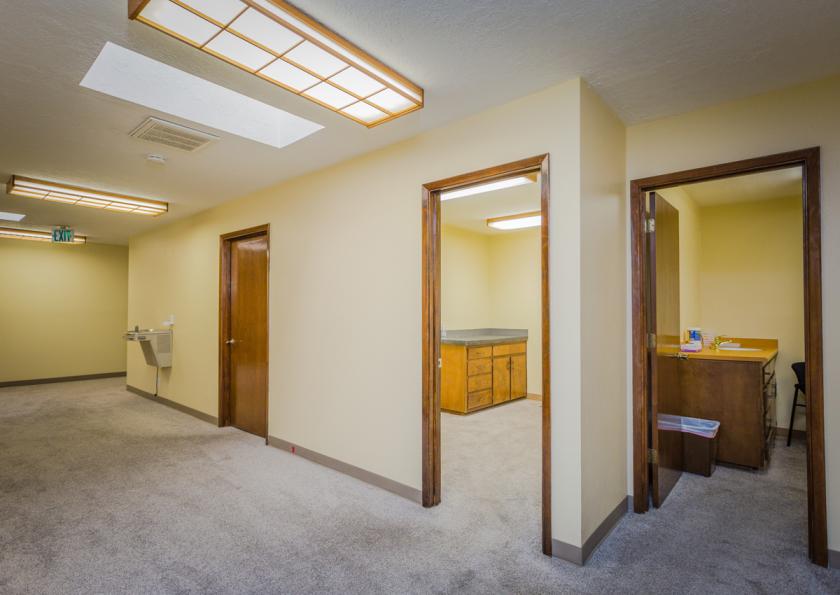
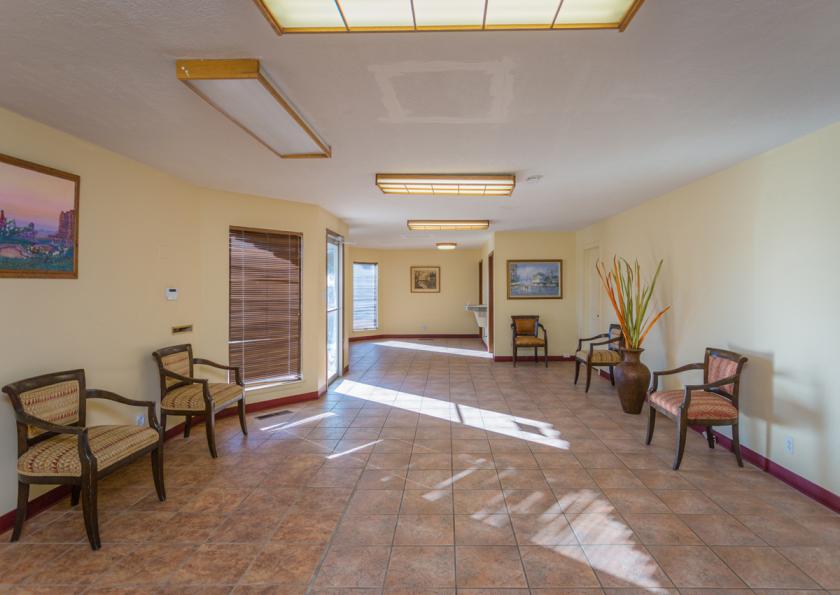
1-Mile | 3-Miles | 5-Miles | ||
---|---|---|---|---|
Total Population | 11,246 | 92,374 | 274,342 | |
Population Median Age | 37 | 41 | 40 | |
Population by Age | 0-9 Yrs | 1598 (14%) | 9839 (10%) | 28644 (10%) |
10-19 Yrs | 1087 (9%) | 9077 (9%) | 29332 (10%) | |
20-29 Yrs | 2110 (18%) | 14860 (16%) | 44369 (16%) | |
30-39 Yrs | 1789 (15%) | 13673 (14%) | 39005 (14%) | |
40-49 Yrs | 1221 (10%) | 10348 (11%) | 31054 (11%) | |
50-59 Yrs | 1379 (12%) | 11741 (12%) | 35365 (12%) | |
60-69 Yrs | 916 (8%) | 11459 (12%) | 33666 (12%) | |
70+ Yrs | 1146 (10%) | 11377 (12%) | 32906 (11%) | |
Median HH Income | $32,434 | $47,524 | $47,668 | |
Total Household Income | < 24K | 1751 (38%) | 11051 (27%) | 33294 (27%) |
25-49K | 1248 (27%) | 10139 (25%) | 29220 (24%) | |
50-74K | 715 (15%) | 6919 (17%) | 20033 (16%) | |
75-99K | 466 (10%) | 4255 (10%) | 12679 (10%) | |
100-199K | 354 (7%) | 6580 (16%) | 19335 (16%) | |
200K+ | 50 (1%) | 1596 (3%) | 5630 (4%) | |
Highest Education Level | No Diploma | 1114 | 5853 | 18927 |
Diploma or GED | 2096 | 14058 | 41248 | |
Some College | 2010 | 16456 | 45085 | |
Assoc. Degree | 741 | 4634 | 13777 | |
Bachelors Degree | 1144 | 13420 | 40396 | |
Higher Degree | 408 | 11994 | 36645 | |
Total Housing Units | 5,062 | 44,693 | 133,992 | |
--Owner-Occupied | 1,735 | 22,138 | 62,869 | |
--Renter-Occupied | 2,850 | 18,401 | 57,322 | |
Owner-Occupied Values | < 100K | 417 | 2677 | 6003 |
100-199K | 1034 | 7969 | 21468 | |
200-299K | 232 | 6671 | 19400 | |
300-399K | 32 | 3314 | 9062 | |
400-499K | 9 | 881 | 3589 | |
500K+ | 11 | 626 | 3347 | |
Total Working Age Population | 8,946 | 77,550 | 229,301 | |
In Work Force | 5,691 | 48,858 | 142,601 | |
Not In Work Force | 3,255 | 28,693 | 86,701 | |
Workforce Employed | 5,399 | 45,590 | 133,707 | |
Workforce Unemployed | 260 | 2,963 | 8,223 | |
Civlian Workforce | 5,658 | 48,553 | 141,930 | |
Military Workforce | 33 | 304 | 671 | |
Total Households | 4,584 | 40,540 | 120,191 | |
Family Households | 2,364 | 20,778 | 61,485 | |
Non-Family Households | 2,220 | 19,761 | 58,706 | |
Married Couple | 1,072 | 13,185 | 38,926 | |
Other Family | 1,291 | 7,593 | 22,559 | |
Married w/Child | 408 | 4,425 | 12,730 | |
Single Male w/Child | 118 | 857 | 2,925 | |
Single Female w/Child | 475 | 2,401 | 8,089 |
Population Change Last Two Decades - Plus Projection
2000 | % | 2010 | % | 2020 | % | 2030 | |
---|---|---|---|---|---|---|---|
New Mexico | 1,819,046 | +13 | 2,059,179 | +6 | 2,187,183 | +6 | 2,308,475 |
Bernalillo County | 556,678 | +19 | 662,564 | +8 | 715,115 | +7 | 763,571 |
Sandoval County | 89,908 | +46 | 131,561 | +13 | 148,708 | +21 | 180,269 |
Total Working Age Population:
Total Households:
Total Working Age Population:
Total Households:
Total Working Age Population:
Total Households: