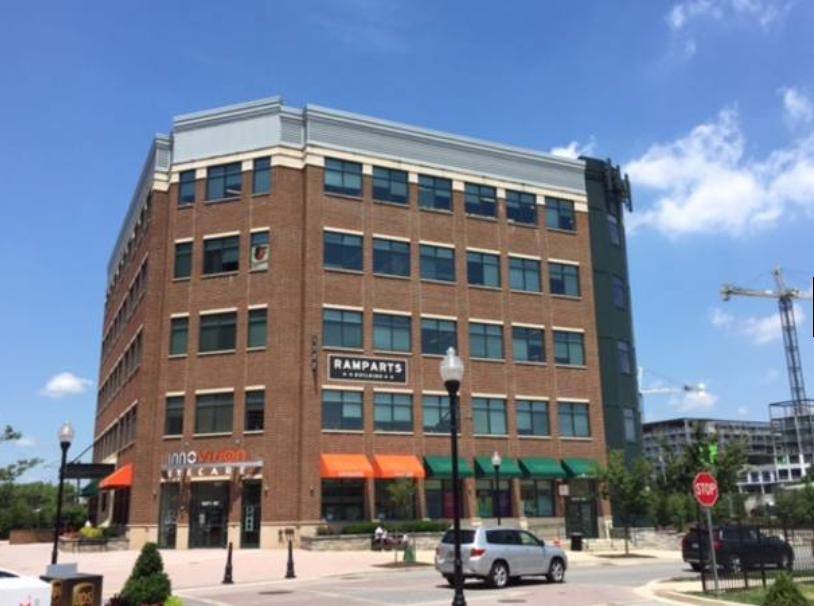
NAIOP award winning development
Strong millennial workforce
Immediate access to I-95
3 parking garages with 1,500 free spaces
110,000 SF retail shopping
473 apartment units
Diamondback Brewing Company
300,000 SF of existing offices
75,000 SF office recently completed - 80% pre-leased
Marriott Courtyard Hotel under construction (126 rooms)
Retail tenants include: Harris Teeter, Iron Rooster, Samos, Dunkin Donuts, M&T Banks, PNC and others
1500 Whetstone Way:
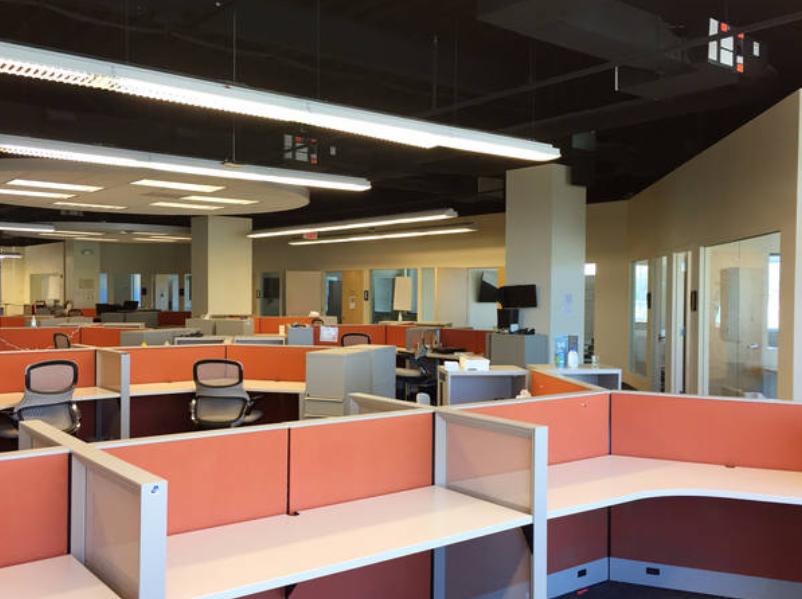
2nd Floor: 6,970 RSF
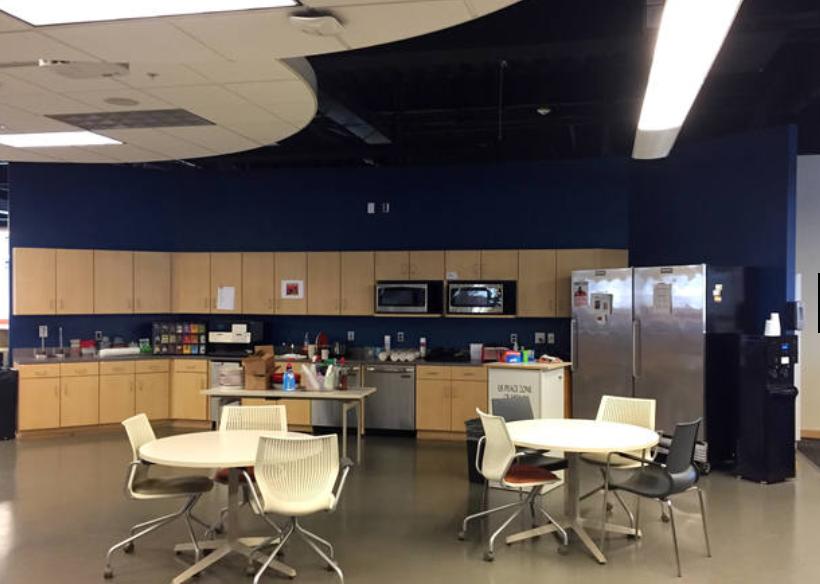
Fully furnished
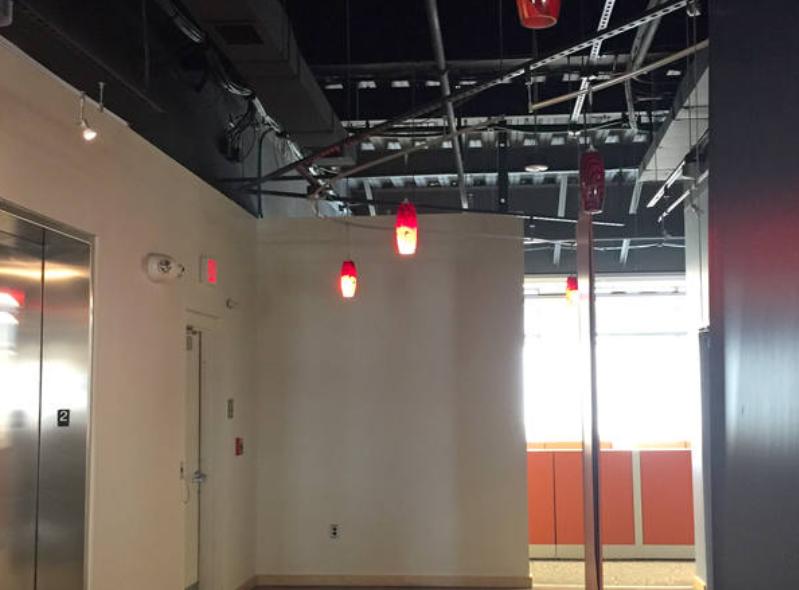
Exposed ceiling
Extensive window line
Collaborative, functional space
Rent: $29.25/RSF + utilities
No part of this information may be copied, reproduced, repurposed, or screen-captured for any commercial purpose without prior written authorization from MyEListing.
While we strive to provide the most accurate information, all listing information, and demographic data, is provided by third-parties. As such, MyEListing will not be responsible for the accuracy of the information. It is strongly recommended that you verify all information with the listing agent, and any relevant agencies, prior to making any decisions.
What is the building size of this commercial Office property?
The size of this lease property at '.1500 Whetstone Way.' is 75000 square feet
What kind of Office is the propery at 1500 Whetstone Way?
The property at 1500 Whetstone Way Baltimore, MD 21230 is listed as a Professional Office property
What is the population within 1 mile of 1500 Whetstone Way in Baltimore?
The population within 1 mile of 1500 Whetstone Way Baltimore, MD 21230 is 24,539 people.
Who do I contact for questions about 1500 Whetstone Way?
You should contact the listing agent,
Joseph Nolan, for any details regarding this commercial listing.