Industrial Properties
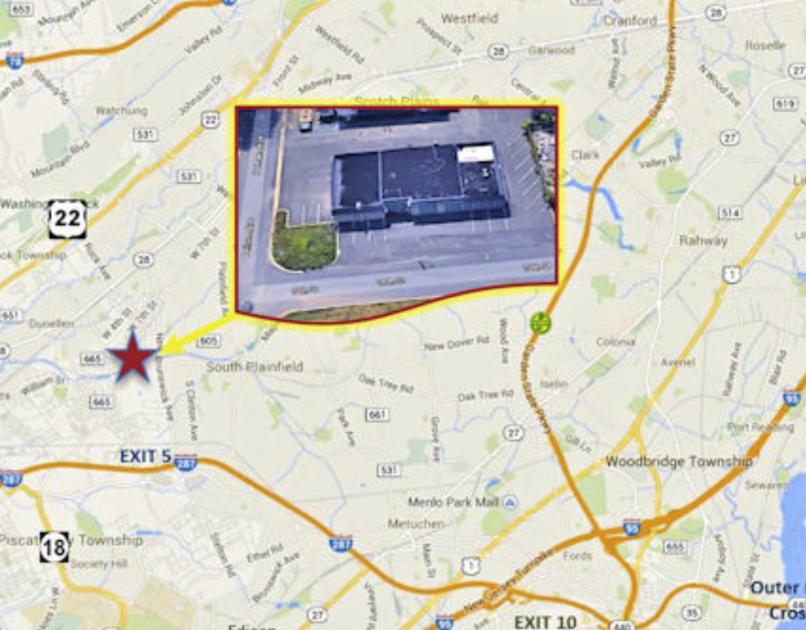
178 10th Street Piscataway, NJ 08854
178 10th Street Piscataway, NJ 08854
Details & Description
Listing Agents

John Papanastasiou
O: 732-985-3000
johnp@naidb.com
O: 732-985-3000
johnp@naidb.com
While we strive to provide the most accurate information, all listing information, and demographic data, is provided by third-parties. As such, MyEListing will not be responsible for the accuracy of the information. It is strongly recommended that you verify all information with the listing agent, and any relevant agencies, prior to making any decisions.