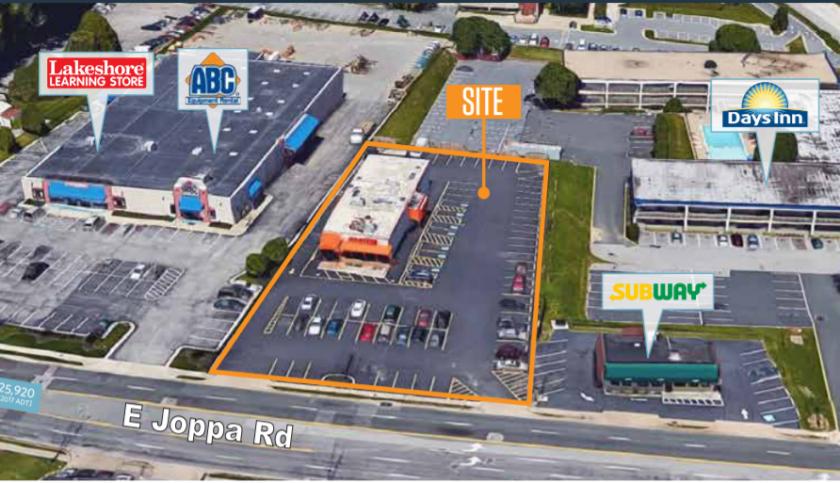
1-Mile | 3-Miles | 5-Miles | ||
---|---|---|---|---|
Total Population | 14,455 | 134,207 | 323,745 | |
Population Median Age | 38 | 39 | 39 | |
Population by Age | 0-9 Yrs | 2023 (13%) | 14818 (11%) | 37067 (11%) |
10-19 Yrs | 1483 (10%) | 17425 (12%) | 41038 (12%) | |
20-29 Yrs | 2112 (14%) | 22239 (16%) | 49027 (15%) | |
30-39 Yrs | 2320 (16%) | 17852 (13%) | 42258 (13%) | |
40-49 Yrs | 1654 (11%) | 15494 (11%) | 38419 (11%) | |
50-59 Yrs | 1525 (10%) | 15990 (11%) | 41896 (12%) | |
60-69 Yrs | 2004 (13%) | 15574 (11%) | 37746 (11%) | |
70+ Yrs | 1334 (9%) | 14815 (11%) | 36294 (11%) | |
Median HH Income | $76,149 | $67,859 | $72,572 | |
Total Household Income | < 24K | 708 (12%) | 7871 (14%) | 17950 (14%) |
25-49K | 1054 (18%) | 11122 (21%) | 23679 (19%) | |
50-74K | 1083 (18%) | 9891 (18%) | 21498 (17%) | |
75-99K | 994 (17%) | 6967 (13%) | 16626 (13%) | |
100-199K | 1603 (27%) | 13088 (24%) | 31939 (26%) | |
200K+ | 340 (5%) | 3829 (7%) | 10819 (8%) | |
Highest Education Level | No Diploma | 663 | 6262 | 16822 |
Diploma or GED | 2564 | 22706 | 54477 | |
Some College | 1934 | 17724 | 43075 | |
Assoc. Degree | 878 | 6472 | 14451 | |
Bachelors Degree | 2106 | 20746 | 48810 | |
Higher Degree | 1808 | 16595 | 42138 | |
Total Housing Units | 6,254 | 57,412 | 133,663 | |
--Owner-Occupied | 3,691 | 30,924 | 78,953 | |
--Renter-Occupied | 2,092 | 21,845 | 43,558 | |
Owner-Occupied Values | < 100K | 88 | 1225 | 4305 |
100-199K | 1506 | 10676 | 27096 | |
200-299K | 1555 | 10497 | 22262 | |
300-399K | 275 | 3943 | 10959 | |
400-499K | 102 | 2253 | 5970 | |
500K+ | 165 | 2331 | 8360 | |
Total Working Age Population | 11,635 | 111,146 | 265,721 | |
In Work Force | 8,281 | 73,644 | 172,335 | |
Not In Work Force | 3,354 | 37,503 | 93,385 | |
Workforce Employed | 7,962 | 69,168 | 162,324 | |
Workforce Unemployed | 307 | 4,181 | 9,483 | |
Civlian Workforce | 8,269 | 73,349 | 171,808 | |
Military Workforce | 12 | 295 | 528 | |
Total Households | 5,782 | 52,768 | 122,511 | |
Family Households | 3,398 | 30,117 | 74,604 | |
Non-Family Households | 2,385 | 22,652 | 47,907 | |
Married Couple | 2,313 | 20,177 | 50,840 | |
Other Family | 1,084 | 9,940 | 23,764 | |
Married w/Child | 1,035 | 8,030 | 20,170 | |
Single Male w/Child | 145 | 1,393 | 2,750 | |
Single Female w/Child | 461 | 3,710 | 8,364 |
Population Change Last Two Decades - Plus Projection
2000 | % | 2010 | % | 2020 | % | 2030 | |
---|---|---|---|---|---|---|---|
Maryland | 5,296,486 | +9 | 5,773,552 | +6 | 6,141,900 | +6 | 6,518,750 |
Baltimore County | 754,292 | +7 | 805,029 | +5 | 847,000 | +2 | 862,200 |
Harford County | 218,590 | +12 | 244,826 | +5 | 257,700 | +5 | 271,850 |
Baltimore city | 651,154 | -5 | 620,961 | -1 | 616,300 | +1 | 625,100 |
Total Working Age Population:
Total Households:
Total Working Age Population:
Total Households:
Total Working Age Population:
Total Households: