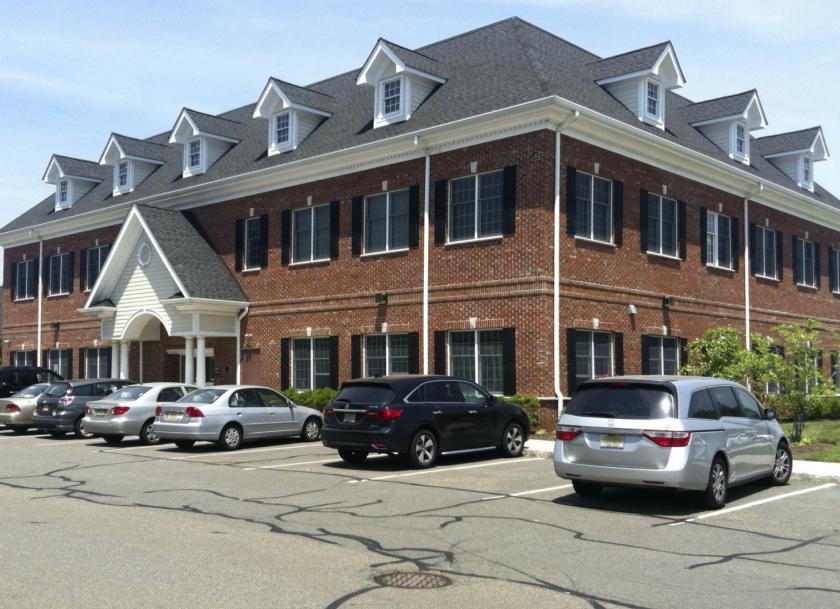
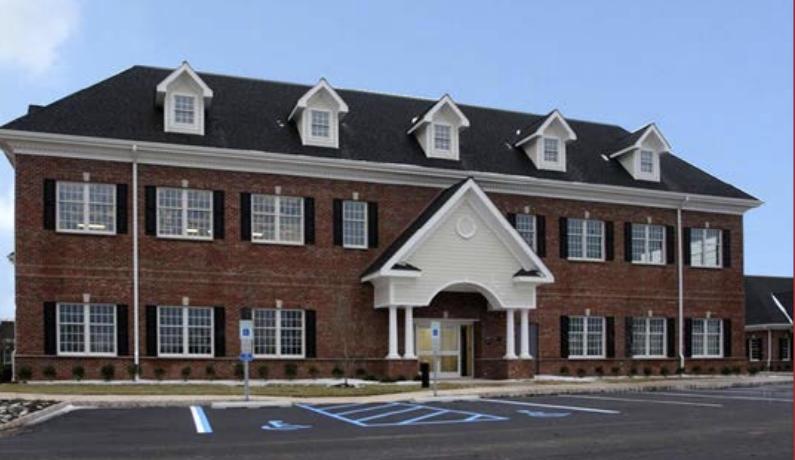
The Durham Professional Center consists of one and two story office buildings — office and medical condominiums. Situated on 9 beautifully landscaped acres.
Durham Professional Center is a 61,500 SF Office/Medical Office Complex consisting of Two - 2 Story Buildings and Five - 1 Story Buildings.
Availability: 1,875 – 3,750 SF – 1st Floor (Divisible) and 2,100 SF – 2nd Floor
24/7 Access; Separate HVAC Systems, separately metered
¼ Mile from Route 287; Easy access to the New Jersey Turnpike, The Garden State Parkway, Routes 22 & 1
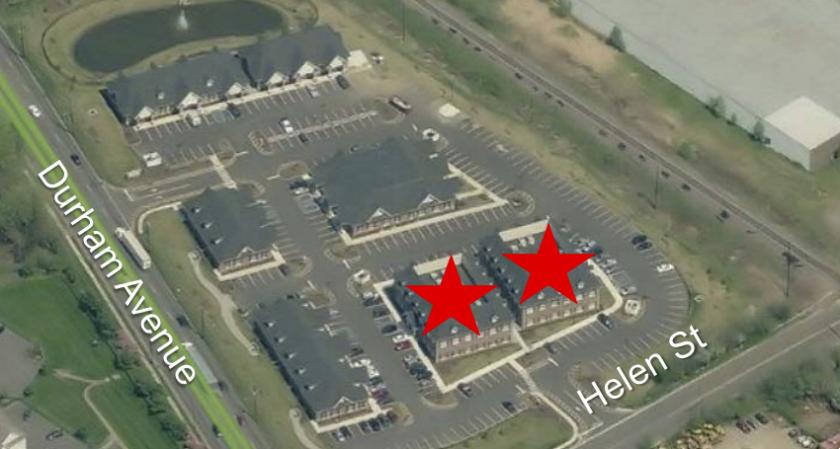
Conveniently located at traffic signal on the corner of Durham Avenue and Helen Street
Located 7 miles away from St. Peter’s University and RWJ University Hospitals and 5 miles away from JFK Medical Center
Area amenities including banking, local shopping and hotels are only minutes away
$15.00 NNN + $8.00 CAM + Separate Utilities
No part of this information may be copied, reproduced, repurposed, or screen-captured for any commercial purpose without prior written authorization from MyEListing.
While we strive to provide the most accurate information, all listing information, and demographic data, is provided by third-parties. As such, MyEListing will not be responsible for the accuracy of the information. It is strongly recommended that you verify all information with the listing agent, and any relevant agencies, prior to making any decisions.
What is the building size of this commercial Office property?
The size of this multi-unit property varies between 1875 - 3750 square feet
What kind of Office is the propery at 285 Durham Avenue?
The property at 285 Durham Avenue South Plainfield, NJ 07080 is listed as a Professional Office property
What is the population within 1 mile of 285 Durham Avenue in South Plainfield?
The population within 1 mile of 285 Durham Avenue South Plainfield, NJ 07080 is 5,876 people.
Who do I contact for questions about 285 Durham Avenue?
You should contact the listing agent,
Christopher Galiano, for any details regarding this commercial listing.