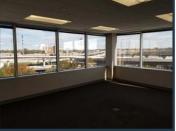
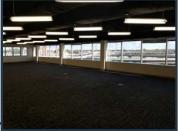
New Building renovations recently completed; Lobby, Common area hallways, bathrooms & elevator cabs.
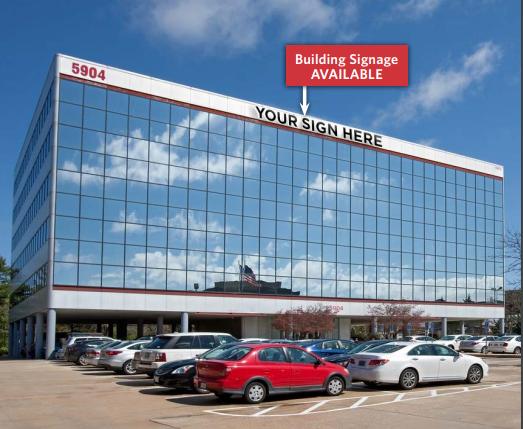
Beltway Building Signage Available for large Tenant
Easy access to Route. 1, I-495, Old Town Alexandria and National Harbor
Ideal for Gov’t Contractors - well located in between DC / Pentagon & Fort Belvoir
Walking distance to Huntington METRO Station (Yellow Line) & Mount Vernon Trail
Free, surface & covered parking at a ratio of 2.72 / 1,000 SF
Term: 3-10 years
No part of this information may be copied, reproduced, repurposed, or screen-captured for any commercial purpose without prior written authorization from MyEListing.
While we strive to provide the most accurate information, all listing information, and demographic data, is provided by third-parties. As such, MyEListing will not be responsible for the accuracy of the information. It is strongly recommended that you verify all information with the listing agent, and any relevant agencies, prior to making any decisions.
What is the asking price for 5904 Richmond Highway in Alexandria?
The asking price for 5904 Richmond Highway is $23.00 - $25.00 a SF per Year
What is the building size of this commercial Office property?
The size of this multi-unit property varies between 2777 - 15356 square feet
What kind of Office is the propery at 5904 Richmond Highway?
The property at 5904 Richmond Highway Alexandria, VA 22303 is listed as a Professional Office property
What is the population within 1 mile of 5904 Richmond Highway in Alexandria?
The population within 1 mile of 5904 Richmond Highway Alexandria, VA 22303 is 25,690 people.
Who do I contact for questions about 5904 Richmond Highway?
You should contact the listing agent,
Jack Regler, for any details regarding this commercial listing.