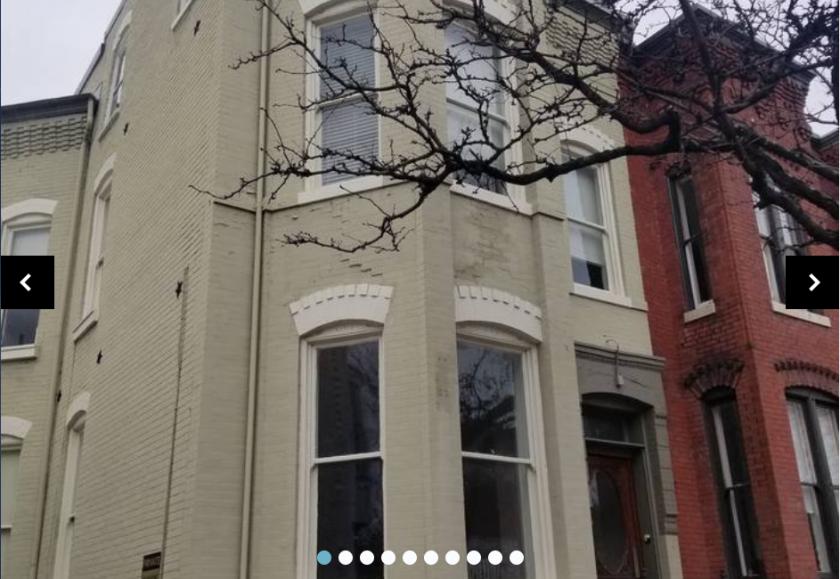
• One of a kind building located 1/2 block north of King Street in Old Town Alexandria
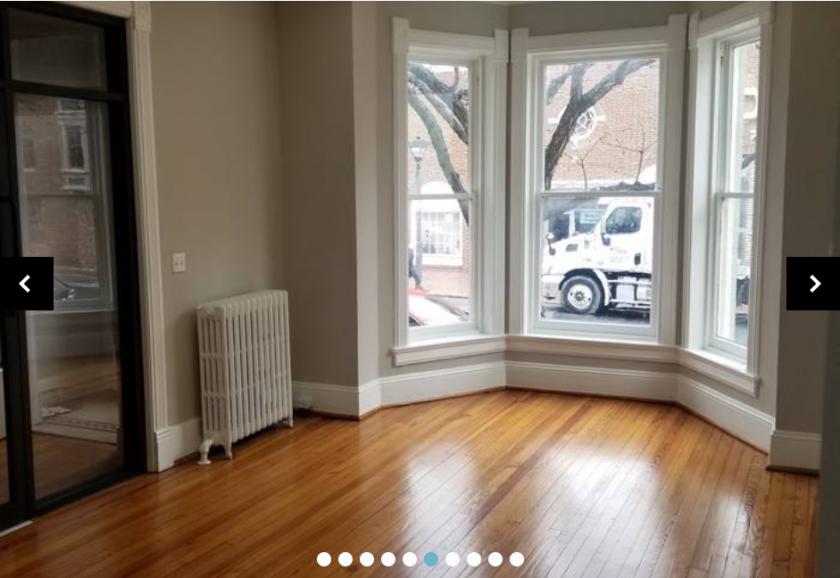
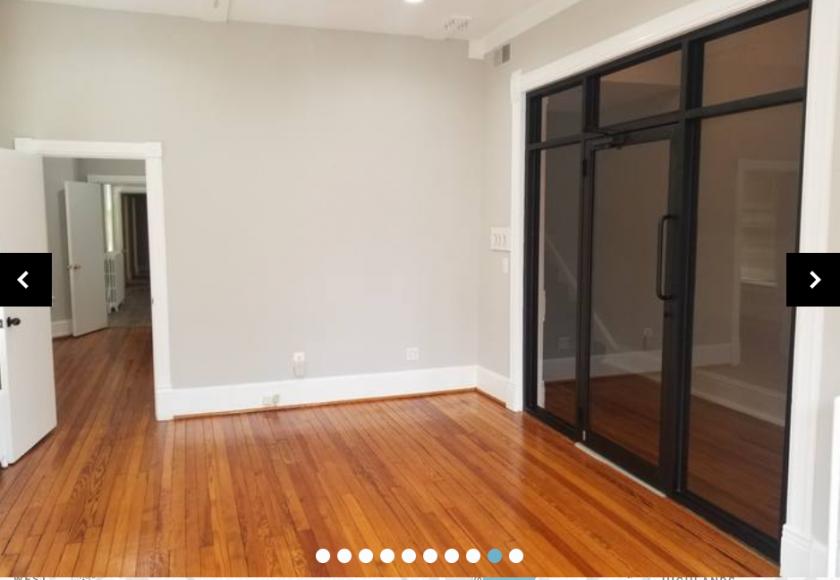
• Approximately 4,144 SF on 2 floors
• 1st floor is current vacant, 2nd floor is under lease through September 2021
• 3 Off-Street parking spaces available (stacked)
• Surrounded by an abundance of King Street restaurants & shopping
• 10 minutes to Amazon HQ2 campus
• Perfect Opportunity for an office USER or residential conversion
• Opportunity for signage/branding facing N. Columbus St
• Asking Price: $1,700,000
No part of this information may be copied, reproduced, repurposed, or screen-captured for any commercial purpose without prior written authorization from MyEListing.
While we strive to provide the most accurate information, all listing information, and demographic data, is provided by third-parties. As such, MyEListing will not be responsible for the accuracy of the information. It is strongly recommended that you verify all information with the listing agent, and any relevant agencies, prior to making any decisions.
What is the asking price for 108 North Columbus Street in Alexandria?
The asking price for 108 North Columbus Street is $1,700,000
What is the building size of this Office property in Alexandria, VA?
The size of the building/unit at 108 North Columbus Street in Alexandria is 4,144 square feet
What kind of Office is the propery at 108 North Columbus Street?
The property at 108 North Columbus Street Alexandria, VA 22314 is listed as a Professional Office property
What is the population within 1 mile of 108 North Columbus Street in Alexandria?
The population within 1 mile of 108 North Columbus Street Alexandria, VA 22314 is 28,643 people.
Who do I contact for questions about 108 North Columbus Street?
You should contact the listing agent,
Jack Regler, for any details regarding this commercial listing.