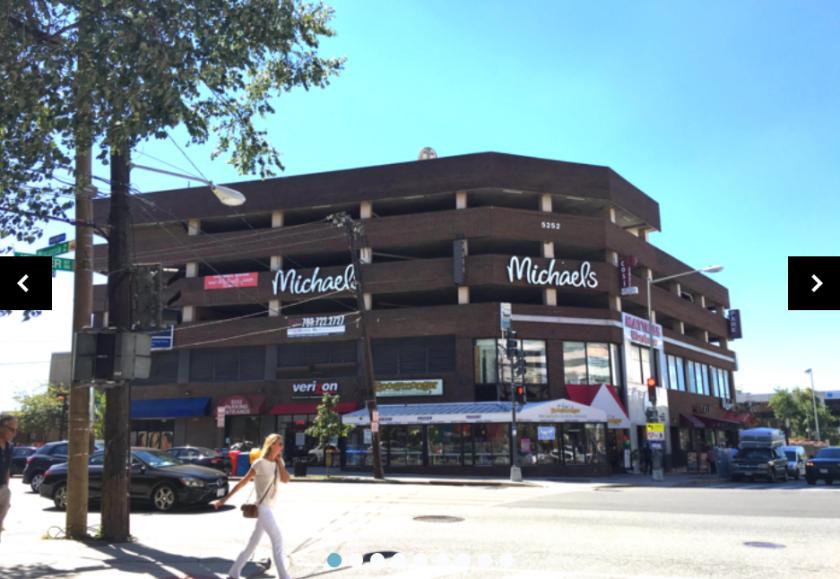
Retail Space
5252 Wisconsin Avenue Northwest Washington, DC 20015
5252 Wisconsin Avenue Northwest Washington, DC 20015
Details & Description
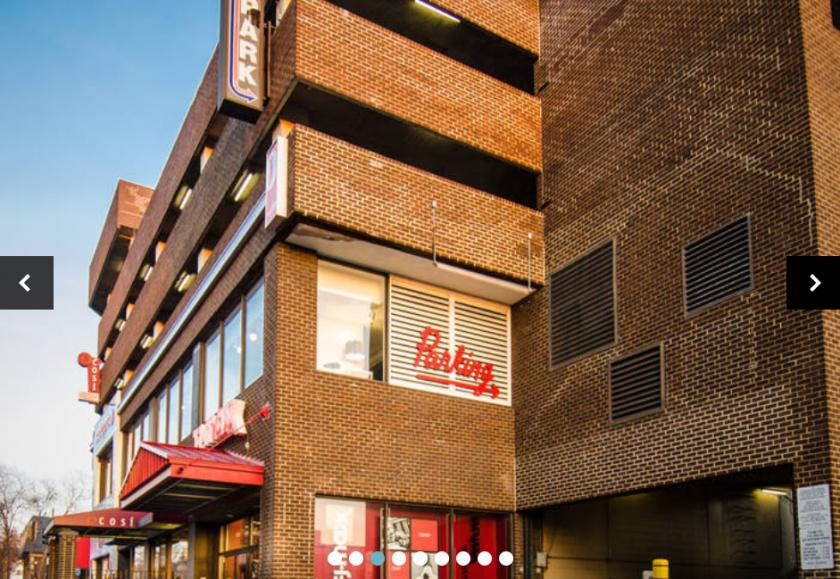
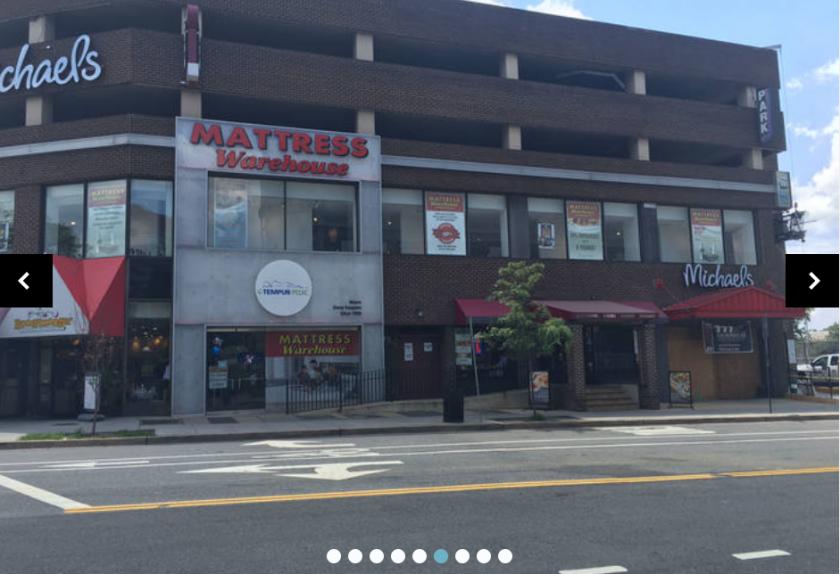
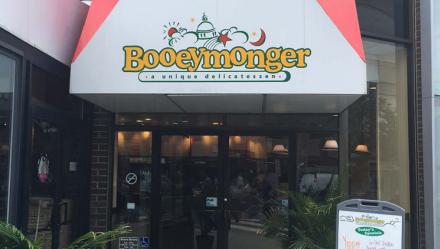
Additional Photos

Listing Agents

Jake Levin
O: 202-909-6102
M: 202-909-6102
jlevin@klnb.com
O: 202-909-6102
M: 202-909-6102
jlevin@klnb.com

Veronica Kamara Salcido
O: 703-268-2714
vkamara@klnb.com
O: 703-268-2714
vkamara@klnb.com

Michael Patz
KLNB
O: 443-632-2043
mpatz@klnb.com
KLNB
O: 443-632-2043
mpatz@klnb.com
While we strive to provide the most accurate information, all listing information, and demographic data, is provided by third-parties. As such, MyEListing will not be responsible for the accuracy of the information. It is strongly recommended that you verify all information with the listing agent, and any relevant agencies, prior to making any decisions.


