No deferred maintenance, the building was completely remodeled in 2019 with new membrane roof, all new electrical system, new HVAC, new plumbing, parking lot resurfaced, new glass storefront and all tenant spaces have been new paint and carpet/flooring.
Zoning: RMF-35 (Moderate Density Multi-family Residential District)
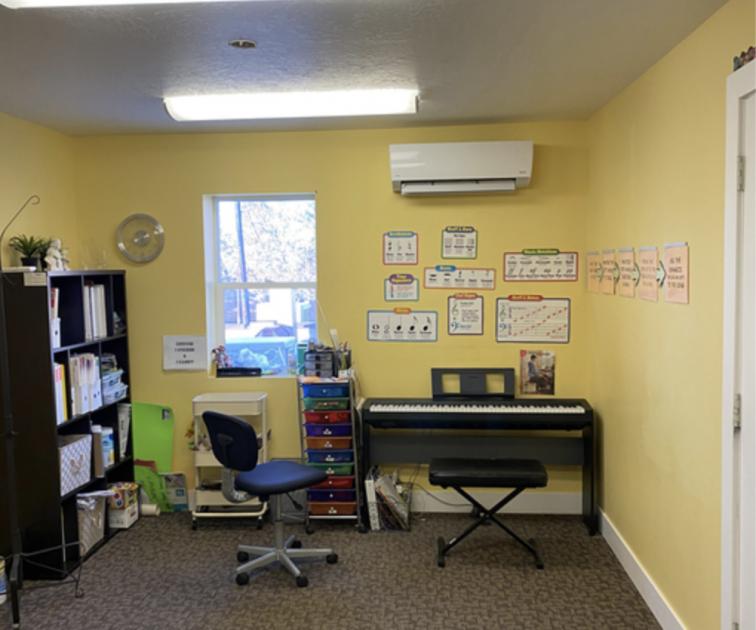
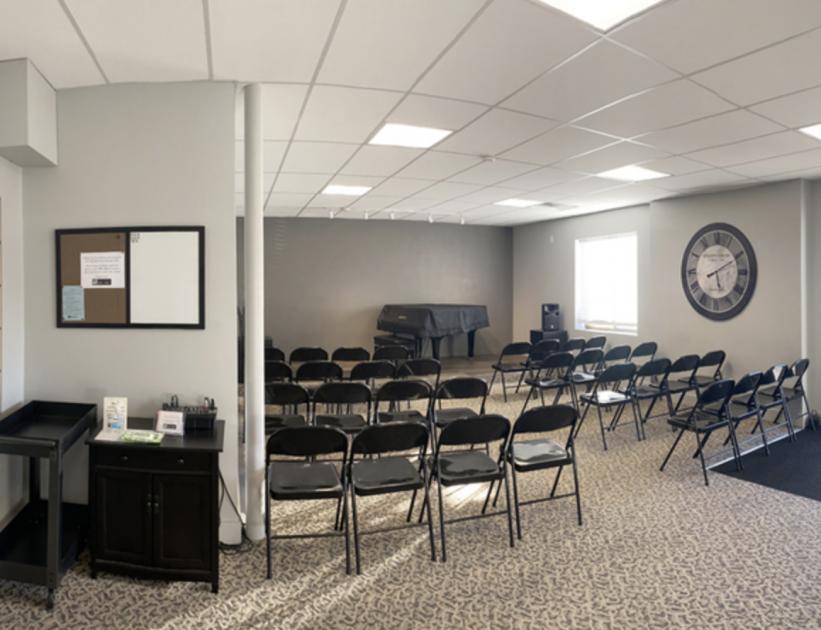
Bountiful Music has been in business and in this location since 1985.
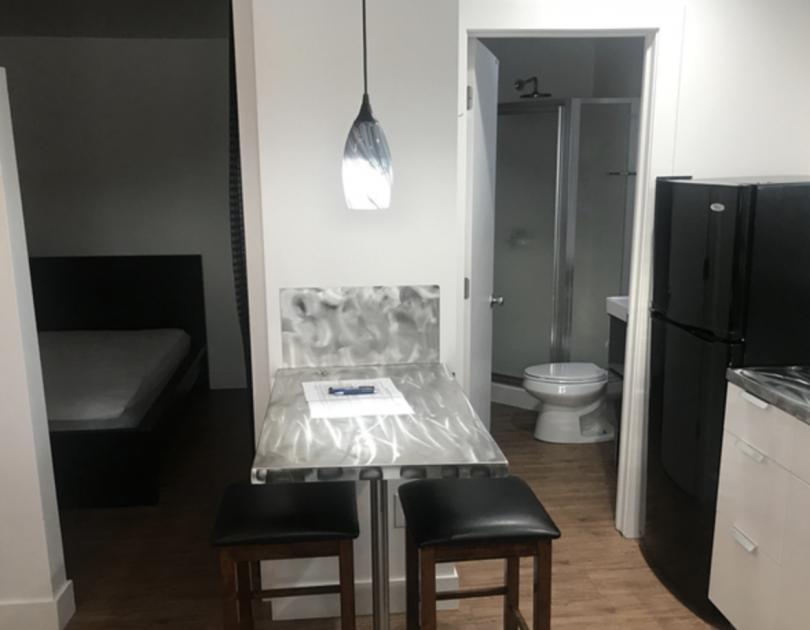
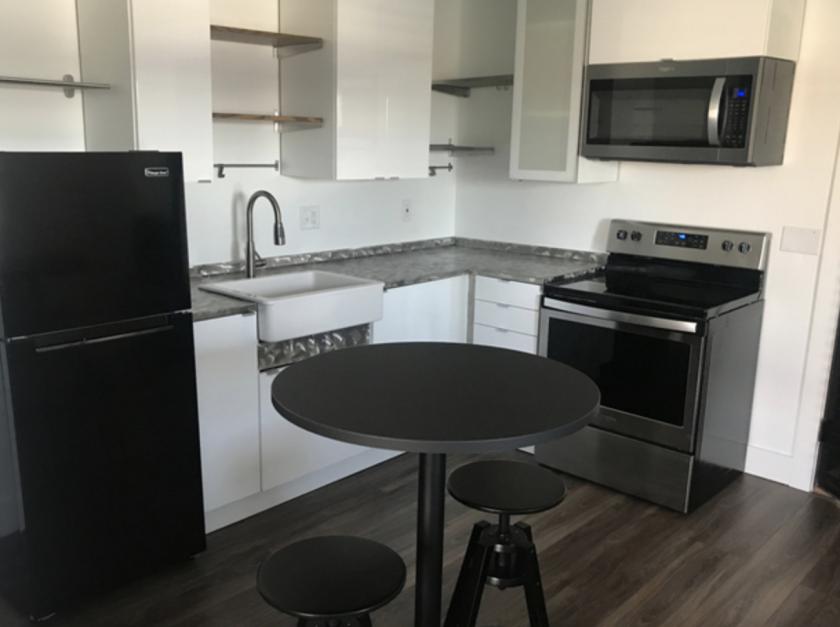
Apartments are always full and very easy to rent when one becomes available.
Rare opportunity to own a property that hasn’t been on the market in decades.
10 minutes north of Salt Lake City.
Retail Tenant’s rent is well below market rates, tons of upside when lease expires.
Apartment leases automatically renew annually and increase $50 per month per year.
The city handles landscaping and south property owner does snow removal.
No part of this information may be copied, reproduced, repurposed, or screen-captured for any commercial purpose without prior written authorization from MyEListing.
While we strive to provide the most accurate information, all listing information, and demographic data, is provided by third-parties. As such, MyEListing will not be responsible for the accuracy of the information. It is strongly recommended that you verify all information with the listing agent, and any relevant agencies, prior to making any decisions.
What is the asking price for 365 North Main Street in Bountiful?
The asking price for 365 North Main Street is $1,200,000
What is the building size of this Retail property in Bountiful, UT?
The size of the building/unit at 365 North Main Street in Bountiful is 5,544 square feet
How much land does the Bountiful, UT property at 365 North Main Street include?
365 North Main Street in Bountiful includes 0.160 acres of land
What kind of Retail is the propery at 365 North Main Street?
The property at 365 North Main Street Bountiful, UT 84010 is listed as a Other Retail Retail property
What is the population within 1 mile of 365 North Main Street in Bountiful?
The population within 1 mile of 365 North Main Street Bountiful, UT 84010 is 15,364 people.
Who do I contact for questions about 365 North Main Street?
You should contact the listing agent,
Artie Lucero, for any details regarding this commercial listing.