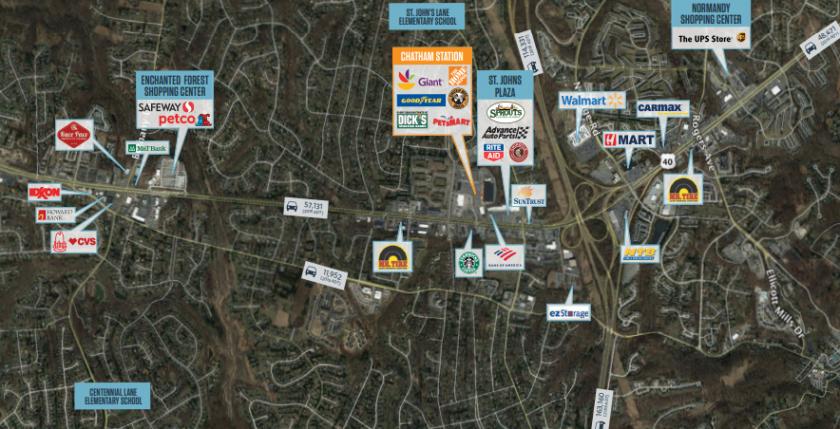
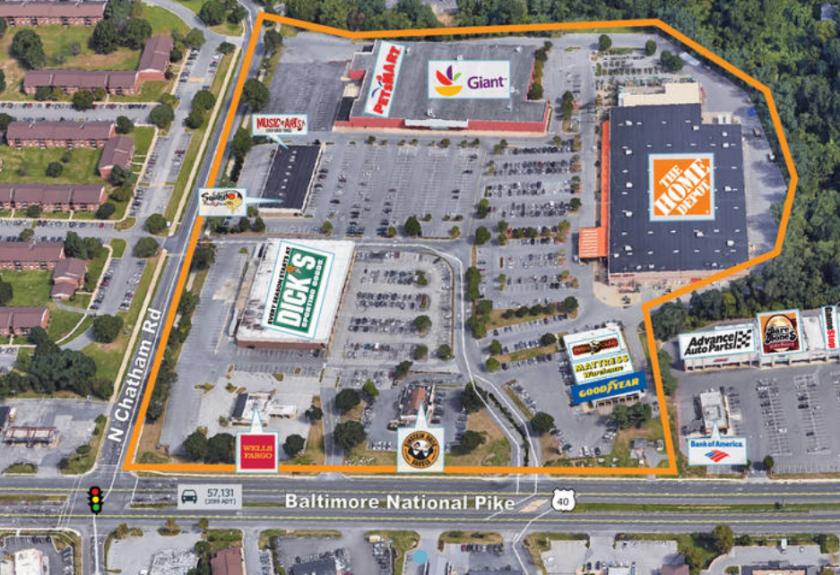
1-Mile | 3-Miles | 5-Miles | ||
---|---|---|---|---|
Total Population | 12,753 | 63,073 | 159,842 | |
Population Median Age | 36 | 39 | 39 | |
Population by Age | 0-9 Yrs | 1840 (14%) | 8175 (12%) | 19463 (12%) |
10-19 Yrs | 2083 (16%) | 8452 (13%) | 21611 (13%) | |
20-29 Yrs | 1210 (9%) | 6041 (9%) | 18191 (11%) | |
30-39 Yrs | 1800 (14%) | 8069 (12%) | 20442 (12%) | |
40-49 Yrs | 2195 (17%) | 9803 (15%) | 23409 (14%) | |
50-59 Yrs | 1628 (12%) | 8958 (14%) | 22431 (14%) | |
60-69 Yrs | 993 (7%) | 7438 (11%) | 17892 (11%) | |
70+ Yrs | 1004 (7%) | 6137 (9%) | 16402 (10%) | |
Median HH Income | $89,729 | $126,281 | $107,780 | |
Total Household Income | < 24K | 399 (9%) | 1776 (7%) | 5210 (8%) |
25-49K | 725 (16%) | 2305 (10%) | 6520 (11%) | |
50-74K | 735 (16%) | 2650 (11%) | 8514 (14%) | |
75-99K | 585 (13%) | 2228 (9%) | 7267 (12%) | |
100-199K | 1209 (27%) | 7625 (33%) | 19678 (33%) | |
200K+ | 754 (17%) | 6051 (26%) | 11890 (20%) | |
Highest Education Level | No Diploma | 384 | 1711 | 5924 |
Diploma or GED | 1384 | 5452 | 16995 | |
Some College | 984 | 4913 | 15364 | |
Assoc. Degree | 497 | 2441 | 6599 | |
Bachelors Degree | 2375 | 13810 | 33528 | |
Higher Degree | 2604 | 15037 | 32550 | |
Total Housing Units | 4,659 | 23,713 | 62,296 | |
--Owner-Occupied | 2,310 | 16,292 | 40,905 | |
--Renter-Occupied | 2,098 | 6,343 | 18,174 | |
Owner-Occupied Values | < 100K | 24 | 117 | 825 |
100-199K | 185 | 520 | 3185 | |
200-299K | 147 | 1204 | 6616 | |
300-399K | 478 | 2275 | 7764 | |
400-499K | 695 | 3561 | 7476 | |
500K+ | 782 | 8615 | 15038 | |
Total Working Age Population | 9,638 | 49,276 | 126,254 | |
In Work Force | 6,450 | 34,139 | 87,278 | |
Not In Work Force | 3,188 | 15,137 | 38,976 | |
Workforce Employed | 6,034 | 32,798 | 83,472 | |
Workforce Unemployed | 347 | 1,121 | 3,322 | |
Civlian Workforce | 6,381 | 33,919 | 86,794 | |
Military Workforce | 69 | 219 | 484 | |
Total Households | 4,408 | 22,635 | 59,079 | |
Family Households | 3,426 | 17,247 | 42,274 | |
Non-Family Households | 982 | 5,388 | 16,804 | |
Married Couple | 2,919 | 15,173 | 33,600 | |
Other Family | 506 | 2,074 | 8,674 | |
Married w/Child | 1,853 | 7,635 | 15,641 | |
Single Male w/Child | 96 | 380 | 1,072 | |
Single Female w/Child | 258 | 708 | 3,190 |
Population Change Last Two Decades - Plus Projection
2000 | % | 2010 | % | 2020 | % | 2030 | |
---|---|---|---|---|---|---|---|
Maryland | 5,296,486 | +9 | 5,773,552 | +6 | 6,141,900 | +6 | 6,518,750 |
Anne Arundel County | 489,656 | +10 | 537,656 | +7 | 573,250 | +4 | 596,700 |
Baltimore County | 754,292 | +7 | 805,029 | +5 | 847,000 | +2 | 862,200 |
Carroll County | 150,897 | +11 | 167,134 | +1 | 169,200 | +4 | 175,150 |
Howard County | 247,842 | +16 | 287,085 | +17 | 336,900 | +9 | 366,800 |
Montgomery County | 873,341 | +11 | 971,777 | +8 | 1,052,050 | +7 | 1,128,800 |
Total Working Age Population:
Total Households:
Total Working Age Population:
Total Households:
Total Working Age Population:
Total Households: