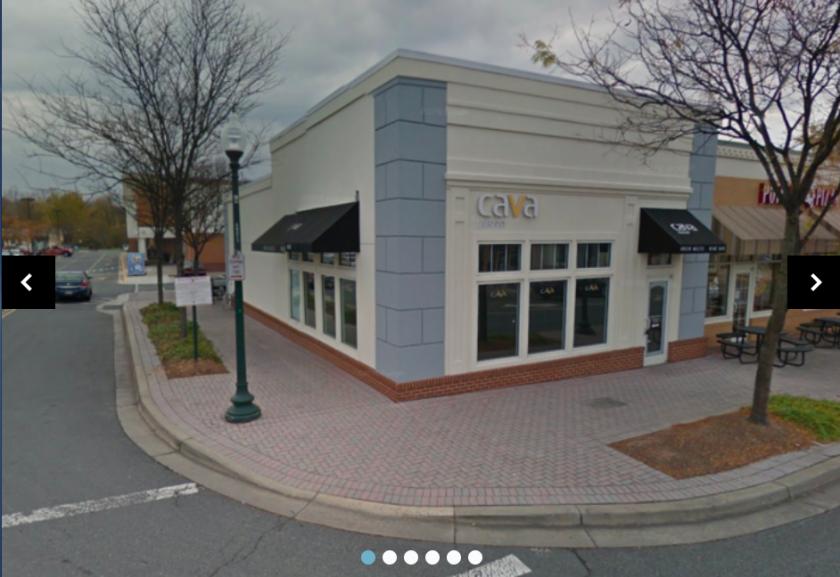
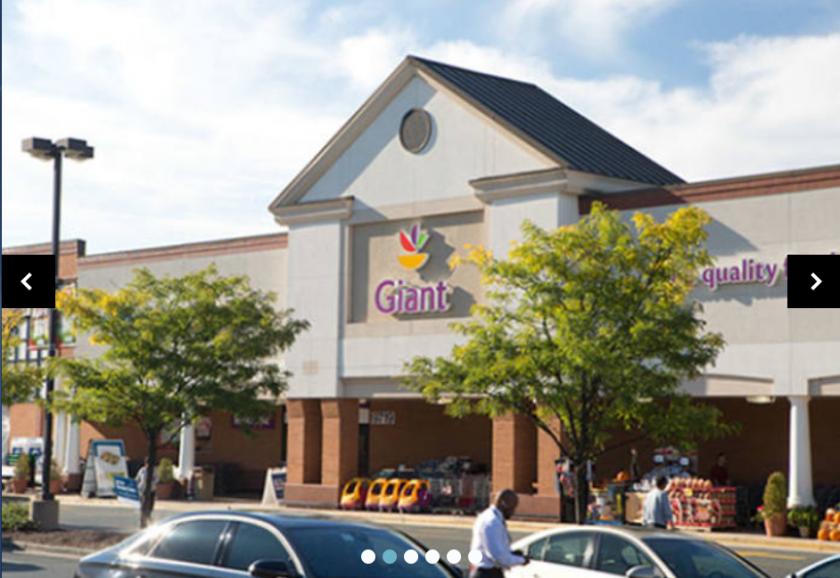
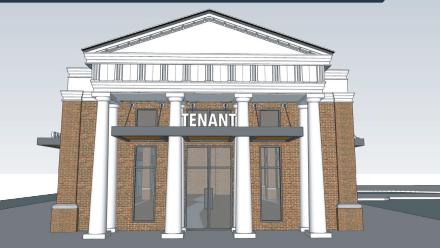
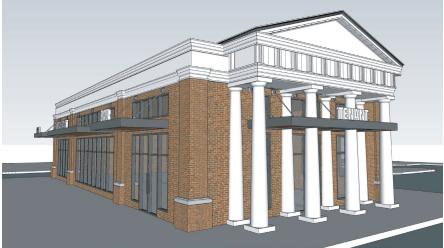
1-Mile | 3-Miles | 5-Miles | ||
---|---|---|---|---|
Total Population | 12,413 | 107,631 | 251,606 | |
Population Median Age | 40 | 40 | 39 | |
Population by Age | 0-9 Yrs | 1344 (10%) | 12851 (11%) | 30791 (12%) |
10-19 Yrs | 1661 (13%) | 13587 (12%) | 31980 (12%) | |
20-29 Yrs | 1087 (8%) | 11601 (10%) | 29306 (11%) | |
30-39 Yrs | 1711 (13%) | 14121 (13%) | 34417 (13%) | |
40-49 Yrs | 2153 (17%) | 16152 (15%) | 35907 (14%) | |
50-59 Yrs | 1876 (15%) | 15866 (14%) | 35554 (14%) | |
60-69 Yrs | 1407 (11%) | 12805 (11%) | 28738 (11%) | |
70+ Yrs | 1173 (9%) | 10647 (9%) | 24913 (9%) | |
Median HH Income | $133,161 | $127,303 | $114,092 | |
Total Household Income | < 24K | 399 (8%) | 3055 (7%) | 8209 (9%) |
25-49K | 458 (9%) | 3637 (9%) | 10386 (11%) | |
50-74K | 347 (7%) | 4369 (10%) | 10822 (12%) | |
75-99K | 559 (11%) | 4478 (11%) | 10496 (11%) | |
100-199K | 1487 (31%) | 13058 (32%) | 27561 (30%) | |
200K+ | 1453 (30%) | 11491 (28%) | 22480 (24%) | |
Highest Education Level | No Diploma | 267 | 3740 | 14976 |
Diploma or GED | 736 | 6427 | 20462 | |
Some College | 916 | 8474 | 20719 | |
Assoc. Degree | 467 | 3177 | 8417 | |
Bachelors Degree | 2618 | 22246 | 48262 | |
Higher Degree | 3904 | 31218 | 60932 | |
Total Housing Units | 4,977 | 41,827 | 94,103 | |
--Owner-Occupied | 2,851 | 25,682 | 56,823 | |
--Renter-Occupied | 1,851 | 14,406 | 33,132 | |
Owner-Occupied Values | < 100K | 40 | 312 | 877 |
100-199K | 36 | 639 | 2399 | |
200-299K | 196 | 2006 | 5226 | |
300-399K | 133 | 2513 | 7985 | |
400-499K | 250 | 2596 | 7445 | |
500K+ | 2196 | 17615 | 32890 | |
Total Working Age Population | 9,998 | 86,197 | 200,957 | |
In Work Force | 6,984 | 60,744 | 141,507 | |
Not In Work Force | 3,014 | 25,452 | 59,450 | |
Workforce Employed | 6,791 | 57,858 | 134,936 | |
Workforce Unemployed | 184 | 2,439 | 5,764 | |
Civlian Workforce | 6,975 | 60,297 | 140,700 | |
Military Workforce | 9 | 447 | 807 | |
Total Households | 4,702 | 40,089 | 89,955 | |
Family Households | 3,372 | 28,630 | 64,255 | |
Non-Family Households | 1,330 | 11,458 | 25,700 | |
Married Couple | 2,854 | 23,345 | 50,988 | |
Other Family | 518 | 5,286 | 13,267 | |
Married w/Child | 1,267 | 10,818 | 23,331 | |
Single Male w/Child | 51 | 482 | 1,343 | |
Single Female w/Child | 247 | 2,092 | 5,074 |
Population Change Last Two Decades - Plus Projection
2000 | % | 2010 | % | 2020 | % | 2030 | |
---|---|---|---|---|---|---|---|
Maryland | 5,296,486 | +9 | 5,773,552 | +6 | 6,141,900 | +6 | 6,518,750 |
Howard County | 247,842 | +16 | 287,085 | +17 | 336,900 | +9 | 366,800 |
Montgomery County | 873,341 | +11 | 971,777 | +8 | 1,052,050 | +7 | 1,128,800 |
Virginia | 7,078,515 | +13 | 8,001,024 | +8 | 8,655,021 | +8 | 9,331,666 |
Fairfax County | 969,749 | +12 | 1,081,726 | +7 | 1,162,504 | +7 | 1,244,025 |
Total Working Age Population:
Total Households:
Total Working Age Population:
Total Households:
Total Working Age Population:
Total Households: