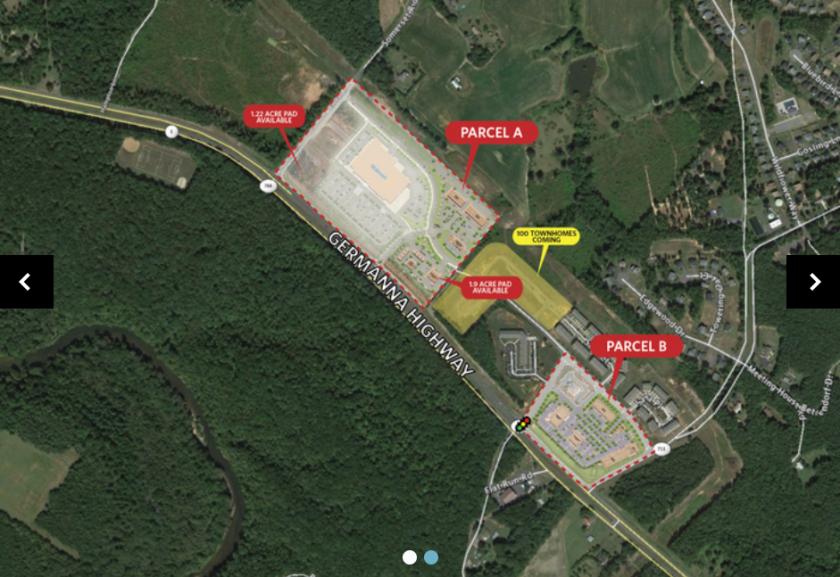
1-Mile | 3-Miles | 5-Miles | ||
---|---|---|---|---|
Total Population | 3,474 | 14,926 | 20,808 | |
Population Median Age | 49 | 42 | 41 | |
Population by Age | 0-9 Yrs | 290 (8%) | 1842 (12%) | 2487 (11%) |
10-19 Yrs | 377 (10%) | 2016 (13%) | 2885 (13%) | |
20-29 Yrs | 225 (6%) | 1232 (8%) | 1838 (8%) | |
30-39 Yrs | 307 (8%) | 1585 (10%) | 2175 (10%) | |
40-49 Yrs | 352 (10%) | 2170 (14%) | 3037 (14%) | |
50-59 Yrs | 511 (14%) | 1924 (12%) | 2870 (13%) | |
60-69 Yrs | 450 (12%) | 1719 (11%) | 2449 (11%) | |
70+ Yrs | 962 (27%) | 2438 (16%) | 3066 (14%) | |
Median HH Income | $82,094 | $90,166 | $93,060 | |
Total Household Income | < 24K | 159 (10%) | 477 (8%) | 586 (7%) |
25-49K | 196 (12%) | 593 (10%) | 819 (10%) | |
50-74K | 311 (20%) | 1176 (21%) | 1465 (19%) | |
75-99K | 316 (20%) | 910 (16%) | 1217 (16%) | |
100-199K | 501 (33%) | 2166 (38%) | 2897 (38%) | |
200K+ | 30 (1%) | 273 (4%) | 515 (6%) | |
Highest Education Level | No Diploma | 78 | 461 | 777 |
Diploma or GED | 638 | 2412 | 3620 | |
Some College | 578 | 2740 | 3660 | |
Assoc. Degree | 233 | 1020 | 1322 | |
Bachelors Degree | 694 | 2196 | 2944 | |
Higher Degree | 425 | 1618 | 2137 | |
Total Housing Units | 1,680 | 6,108 | 8,150 | |
--Owner-Occupied | 1,453 | 5,308 | 7,101 | |
--Renter-Occupied | 60 | 287 | 398 | |
Owner-Occupied Values | < 100K | 12 | 99 | 156 |
100-199K | 218 | 1029 | 1289 | |
200-299K | 670 | 2157 | 2673 | |
300-399K | 448 | 1428 | 1812 | |
400-499K | 52 | 221 | 382 | |
500K+ | 53 | 373 | 790 | |
Total Working Age Population | 3,021 | 12,011 | 16,728 | |
In Work Force | 1,655 | 7,479 | 10,417 | |
Not In Work Force | 1,366 | 4,532 | 6,312 | |
Workforce Employed | 1,441 | 6,946 | 9,725 | |
Workforce Unemployed | 214 | 520 | 667 | |
Civlian Workforce | 1,655 | 7,466 | 10,392 | |
Military Workforce | 0 | 13 | 24 | |
Total Households | 1,513 | 5,595 | 7,499 | |
Family Households | 1,007 | 4,108 | 5,697 | |
Non-Family Households | 506 | 1,487 | 1,802 | |
Married Couple | 778 | 3,461 | 4,819 | |
Other Family | 230 | 647 | 878 | |
Married w/Child | 154 | 1,265 | 1,766 | |
Single Male w/Child | 61 | 155 | 188 | |
Single Female w/Child | 59 | 178 | 226 |
Population Change Last Two Decades - Plus Projection
2000 | % | 2010 | % | 2020 | % | 2030 | |
---|---|---|---|---|---|---|---|
Virginia | 7,078,515 | +13 | 8,001,024 | +8 | 8,655,021 | +8 | 9,331,666 |
Culpeper County | 34,262 | +36 | 46,689 | +12 | 52,422 | +17 | 61,073 |
Fauquier County | 55,139 | +18 | 65,203 | +9 | 71,395 | +10 | 78,698 |
Orange County | 25,881 | +29 | 33,481 | +8 | 36,119 | +13 | 40,969 |
Spotsylvania County | 90,395 | +35 | 122,397 | +11 | 136,192 | +16 | 158,025 |
Total Working Age Population:
Total Households:
Total Working Age Population:
Total Households:
Total Working Age Population:
Total Households: