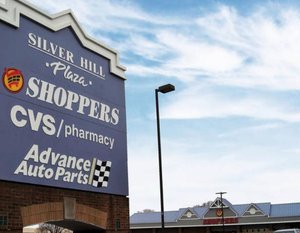
1-Mile | 3-Miles | 5-Miles | ||
---|---|---|---|---|
Total Population | 17,066 | 165,178 | 513,494 | |
Population Median Age | 39 | 38 | 38 | |
Population by Age | 0-9 Yrs | 2054 (12%) | 22567 (13%) | 65636 (12%) |
10-19 Yrs | 1941 (11%) | 18950 (11%) | 52110 (10%) | |
20-29 Yrs | 2020 (11%) | 21087 (12%) | 76029 (14%) | |
30-39 Yrs | 2545 (14%) | 26273 (15%) | 92353 (17%) | |
40-49 Yrs | 2651 (15%) | 23420 (14%) | 72565 (14%) | |
50-59 Yrs | 2290 (13%) | 21114 (12%) | 62881 (12%) | |
60-69 Yrs | 2170 (12%) | 17755 (10%) | 50336 (9%) | |
70+ Yrs | 1395 (8%) | 14012 (8%) | 41585 (8%) | |
Median HH Income | $120,226 | $119,466 | $109,675 | |
Total Household Income | < 24K | 462 (7%) | 5219 (8%) | 18861 (9%) |
25-49K | 608 (10%) | 6630 (11%) | 23031 (11%) | |
50-74K | 556 (9%) | 6573 (11%) | 25794 (12%) | |
75-99K | 674 (11%) | 6344 (10%) | 24617 (12%) | |
100-199K | 2153 (36%) | 19094 (32%) | 64461 (32%) | |
200K+ | 1411 (24%) | 15110 (25%) | 44027 (21%) | |
Highest Education Level | No Diploma | 1521 | 13457 | 33591 |
Diploma or GED | 1654 | 14850 | 44301 | |
Some College | 1670 | 12078 | 41824 | |
Assoc. Degree | 610 | 5452 | 17543 | |
Bachelors Degree | 3504 | 33445 | 111915 | |
Higher Degree | 3232 | 35429 | 116505 | |
Total Housing Units | 6,079 | 61,912 | 213,160 | |
--Owner-Occupied | 4,173 | 37,369 | 105,031 | |
--Renter-Occupied | 1,690 | 21,601 | 95,760 | |
Owner-Occupied Values | < 100K | 4 | 203 | 895 |
100-199K | 81 | 1506 | 5103 | |
200-299K | 113 | 1792 | 8858 | |
300-399K | 407 | 2471 | 9732 | |
400-499K | 896 | 5253 | 13879 | |
500K+ | 2672 | 26145 | 66564 | |
Total Working Age Population | 13,769 | 130,596 | 415,342 | |
In Work Force | 10,049 | 95,210 | 309,161 | |
Not In Work Force | 3,720 | 35,386 | 106,181 | |
Workforce Employed | 9,543 | 91,048 | 296,104 | |
Workforce Unemployed | 428 | 3,342 | 9,870 | |
Civlian Workforce | 9,970 | 94,390 | 305,974 | |
Military Workforce | 79 | 820 | 3,187 | |
Total Households | 5,864 | 58,970 | 200,791 | |
Family Households | 4,135 | 39,424 | 117,249 | |
Non-Family Households | 1,728 | 19,546 | 83,542 | |
Married Couple | 3,314 | 31,062 | 91,003 | |
Other Family | 821 | 8,361 | 26,245 | |
Married w/Child | 1,565 | 15,355 | 43,481 | |
Single Male w/Child | 59 | 1,016 | 2,927 | |
Single Female w/Child | 245 | 2,859 | 9,026 |
Population Change Last Two Decades - Plus Projection
2000 | % | 2010 | % | 2020 | % | 2030 | |
---|---|---|---|---|---|---|---|
District of Columbia | 572,059 | +5 | 601,723 | +21 | 729,501 | +15 | 842,154 |
Maryland | 5,296,486 | +9 | 5,773,552 | +6 | 6,141,900 | +6 | 6,518,750 |
Montgomery County | 873,341 | +11 | 971,777 | +8 | 1,052,050 | +7 | 1,128,800 |
Prince Georges County | 801,515 | +8 | 863,420 | +6 | 916,150 | +4 | 952,950 |
Virginia | 7,078,515 | +13 | 8,001,024 | +8 | 8,655,021 | +8 | 9,331,666 |
Arlington County | 189,453 | +10 | 207,627 | +20 | 249,298 | +10 | 274,339 |
Fairfax County | 969,749 | +12 | 1,081,726 | +7 | 1,162,504 | +7 | 1,244,025 |
Prince William County | 280,813 | +43 | 402,002 | +19 | 478,134 | +20 | 571,844 |
Alexandria city | 128,283 | +9 | 139,966 | +19 | 166,261 | +10 | 182,067 |
Falls Church city | 10,377 | +19 | 12,332 | +22 | 14,988 | +14 | 17,032 |
Total Working Age Population:
Total Households:
Total Working Age Population:
Total Households:
Total Working Age Population:
Total Households: