Industrial Properties
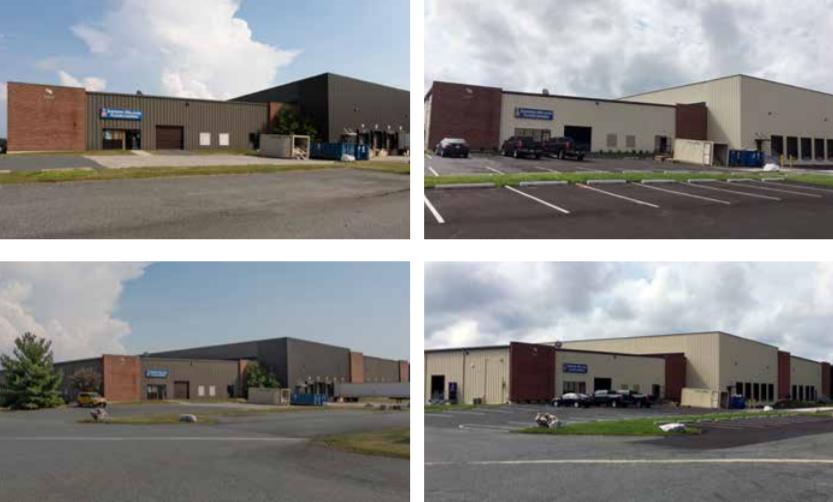
1011 Old Philadelphia Road Aberdeen, MD 21001
1011 Old Philadelphia Road Aberdeen, MD 21001

Details & Description
Listing Agents

Peter Dudley
O: 443-632-2064
M: 410-952-3513
pdudley@klnb.com
O: 443-632-2064
M: 410-952-3513
pdudley@klnb.com

Christopher Wright
O: 443-914-2600
M: 410-458-6700
cwright@klnb.com
O: 443-914-2600
M: 410-458-6700
cwright@klnb.com
While we strive to provide the most accurate information, all listing information, and demographic data, is provided by third-parties. As such, MyEListing will not be responsible for the accuracy of the information. It is strongly recommended that you verify all information with the listing agent, and any relevant agencies, prior to making any decisions.