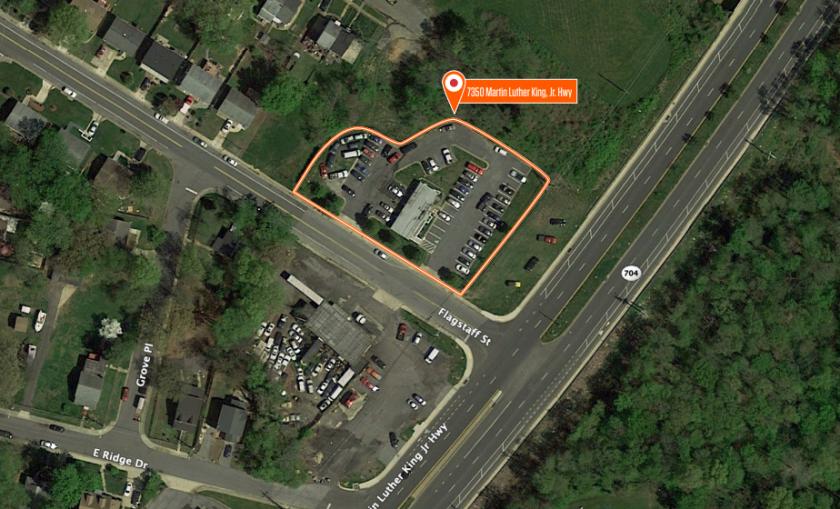
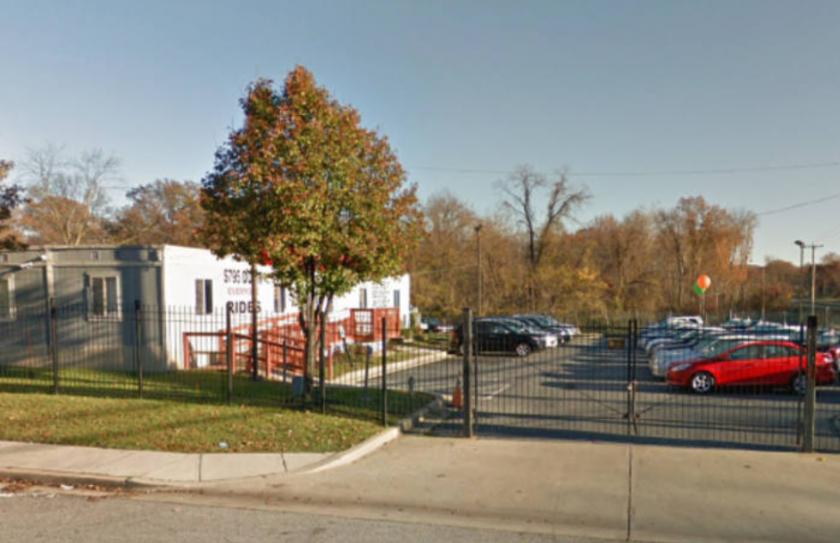
1-Mile | 3-Miles | 5-Miles | ||
---|---|---|---|---|
Total Population | 16,261 | 131,416 | 361,469 | |
Population Median Age | 36 | 37 | 37 | |
Population by Age | 0-9 Yrs | 2577 (15%) | 19281 (14%) | 50543 (13%) |
10-19 Yrs | 2001 (12%) | 16303 (12%) | 43736 (12%) | |
20-29 Yrs | 2044 (12%) | 17232 (13%) | 49946 (13%) | |
30-39 Yrs | 2480 (15%) | 20274 (15%) | 53407 (14%) | |
40-49 Yrs | 2363 (14%) | 16071 (12%) | 44685 (12%) | |
50-59 Yrs | 1981 (12%) | 17341 (13%) | 48970 (13%) | |
60-69 Yrs | 1664 (10%) | 13995 (10%) | 39983 (11%) | |
70+ Yrs | 1152 (7%) | 10919 (8%) | 30199 (8%) | |
Median HH Income | $61,443 | $69,469 | $69,211 | |
Total Household Income | < 24K | 1121 (18%) | 7038 (15%) | 21584 (16%) |
25-49K | 1309 (21%) | 8579 (18%) | 23481 (18%) | |
50-74K | 1208 (20%) | 9795 (20%) | 23768 (18%) | |
75-99K | 972 (16%) | 7158 (15%) | 18054 (14%) | |
100-199K | 1200 (20%) | 11734 (25%) | 31937 (25%) | |
200K+ | 155 (2%) | 2350 (5%) | 8350 (6%) | |
Highest Education Level | No Diploma | 1784 | 13068 | 36836 |
Diploma or GED | 4153 | 27395 | 74303 | |
Some College | 2401 | 19176 | 52484 | |
Assoc. Degree | 422 | 5446 | 14032 | |
Bachelors Degree | 1141 | 13512 | 37970 | |
Higher Degree | 754 | 9362 | 28925 | |
Total Housing Units | 6,477 | 50,503 | 137,269 | |
--Owner-Occupied | 2,911 | 26,133 | 72,287 | |
--Renter-Occupied | 3,055 | 20,522 | 54,889 | |
Owner-Occupied Values | < 100K | 262 | 1468 | 3218 |
100-199K | 1320 | 5820 | 12084 | |
200-299K | 940 | 10122 | 26386 | |
300-399K | 289 | 5857 | 18431 | |
400-499K | 58 | 1786 | 7361 | |
500K+ | 42 | 1080 | 4807 | |
Total Working Age Population | 12,577 | 102,127 | 284,549 | |
In Work Force | 9,021 | 71,977 | 197,202 | |
Not In Work Force | 3,556 | 30,150 | 87,347 | |
Workforce Employed | 8,220 | 66,053 | 180,784 | |
Workforce Unemployed | 775 | 5,740 | 16,115 | |
Civlian Workforce | 8,995 | 71,794 | 196,900 | |
Military Workforce | 26 | 183 | 302 | |
Total Households | 5,966 | 46,654 | 127,175 | |
Family Households | 3,769 | 29,170 | 78,848 | |
Non-Family Households | 2,197 | 17,485 | 48,327 | |
Married Couple | 1,533 | 14,856 | 40,305 | |
Other Family | 2,236 | 14,313 | 38,543 | |
Married w/Child | 679 | 6,373 | 15,925 | |
Single Male w/Child | 211 | 1,098 | 3,040 | |
Single Female w/Child | 684 | 5,155 | 13,676 |
Population Change Last Two Decades - Plus Projection
2000 | % | 2010 | % | 2020 | % | 2030 | |
---|---|---|---|---|---|---|---|
District of Columbia | 572,059 | +5 | 601,723 | +21 | 729,501 | +15 | 842,154 |
Maryland | 5,296,486 | +9 | 5,773,552 | +6 | 6,141,900 | +6 | 6,518,750 |
Anne Arundel County | 489,656 | +10 | 537,656 | +7 | 573,250 | +4 | 596,700 |
Montgomery County | 873,341 | +11 | 971,777 | +8 | 1,052,050 | +7 | 1,128,800 |
Prince Georges County | 801,515 | +8 | 863,420 | +6 | 916,150 | +4 | 952,950 |
Total Working Age Population:
Total Households:
Total Working Age Population:
Total Households:
Total Working Age Population:
Total Households: