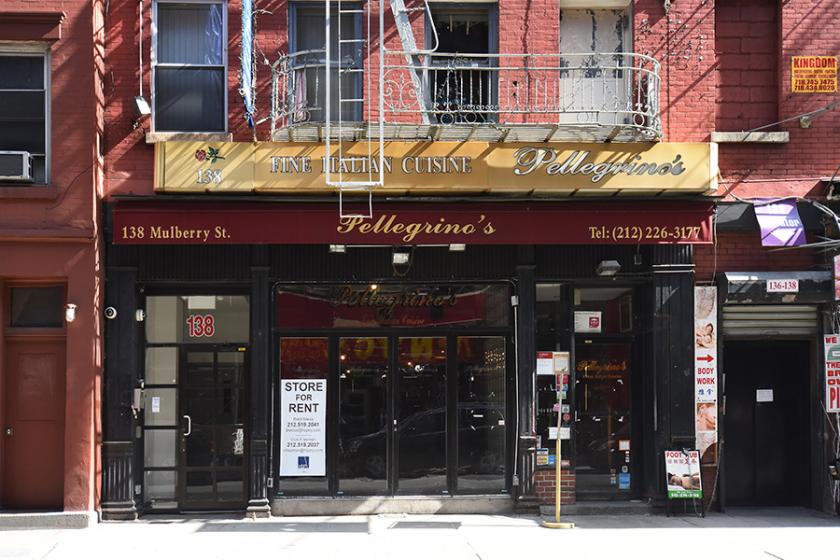
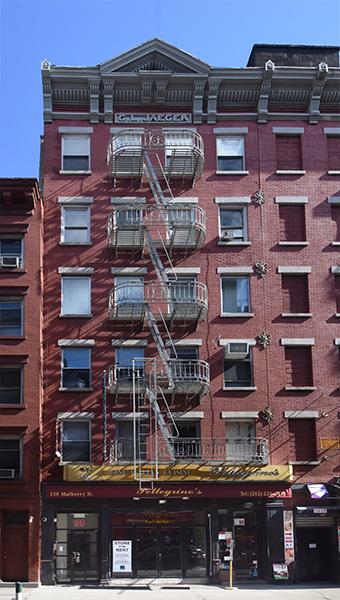
1-Mile | 3-Miles | 5-Miles | ||
---|---|---|---|---|
Total Population | 207,296 | 1,093,750 | 2,563,270 | |
Population Median Age | 41 | 37 | 38 | |
Population by Age | 0-9 Yrs | 14884 (7%) | 111377 (10%) | 275254 (10%) |
10-19 Yrs | 14005 (6%) | 80540 (7%) | 208407 (8%) | |
20-29 Yrs | 42957 (20%) | 223154 (20%) | 477145 (18%) | |
30-39 Yrs | 38961 (18%) | 254175 (23%) | 540275 (21%) | |
40-49 Yrs | 25559 (12%) | 139227 (12%) | 335372 (13%) | |
50-59 Yrs | 22479 (10%) | 105660 (9%) | 274129 (10%) | |
60-69 Yrs | 22727 (10%) | 92202 (8%) | 227998 (8%) | |
70+ Yrs | 25723 (12%) | 87415 (7%) | 224689 (8%) | |
Median HH Income | $80,998 | $110,417 | $92,425 | |
Total Household Income | < 24K | 23486 (24%) | 89024 (17%) | 209461 (18%) |
25-49K | 13181 (13%) | 56185 (10%) | 151569 (13%) | |
50-74K | 10136 (10%) | 48453 (9%) | 130839 (11%) | |
75-99K | 8356 (8%) | 45870 (8%) | 113729 (9%) | |
100-199K | 20931 (21%) | 134803 (26%) | 285715 (25%) | |
200K+ | 21527 (22%) | 140027 (27%) | 250983 (21%) | |
Highest Education Level | No Diploma | 29876 | 81130 | 219513 |
Diploma or GED | 19609 | 88164 | 291669 | |
Some College | 12301 | 67054 | 189037 | |
Assoc. Degree | 5118 | 24313 | 75837 | |
Bachelors Degree | 56182 | 312793 | 624445 | |
Higher Degree | 39241 | 254993 | 516391 | |
Total Housing Units | 110,599 | 582,241 | 1,302,058 | |
--Owner-Occupied | 19,276 | 128,170 | 300,957 | |
--Renter-Occupied | 78,341 | 386,192 | 841,340 | |
Owner-Occupied Values | < 100K | 988 | 4410 | 8404 |
100-199K | 227 | 2977 | 8447 | |
200-299K | 375 | 3152 | 13996 | |
300-399K | 562 | 5266 | 19161 | |
400-499K | 950 | 7162 | 20045 | |
500K+ | 16174 | 105203 | 230904 | |
Total Working Age Population | 185,411 | 938,896 | 2,164,247 | |
In Work Force | 118,997 | 677,446 | 1,526,518 | |
Not In Work Force | 66,413 | 261,450 | 637,729 | |
Workforce Employed | 113,481 | 648,169 | 1,454,144 | |
Workforce Unemployed | 5,495 | 29,085 | 71,815 | |
Civlian Workforce | 118,975 | 677,255 | 1,525,959 | |
Military Workforce | 22 | 191 | 559 | |
Total Households | 97,616 | 514,362 | 1,142,297 | |
Family Households | 40,333 | 216,449 | 540,743 | |
Non-Family Households | 57,283 | 297,913 | 601,554 | |
Married Couple | 28,951 | 164,630 | 378,009 | |
Other Family | 11,382 | 51,819 | 162,735 | |
Married w/Child | 9,359 | 65,239 | 153,763 | |
Single Male w/Child | 792 | 4,206 | 14,111 | |
Single Female w/Child | 2,681 | 16,254 | 51,784 |
Population Change Last Two Decades - Plus Projection
2000 | % | 2010 | % | 2020 | % | 2030 | |
---|---|---|---|---|---|---|---|
New Jersey | 8,414,350 | +4 | 8,791,894 | +4 | 9,132,700 | +4 | 9,530,900 |
Bergen County | 884,118 | +2 | 905,116 | +7 | 967,500 | +7 | 1,031,500 |
Hudson County | 608,975 | +4 | 634,266 | +12 | 708,100 | +6 | 747,400 |
New York | 18,976,457 | +2 | 19,378,102 | +4 | 20,146,131 | +2 | 20,604,030 |
Kings County | 2,465,326 | +2 | 2,504,700 | +9 | 2,738,283 | +5 | 2,863,996 |
New York County | 1,537,195 | +3 | 1,585,873 | +6 | 1,688,894 | +2 | 1,727,631 |
Queens County | 2,229,379 | 0 | 2,230,722 | +9 | 2,436,549 | +5 | 2,565,268 |
Richmond County | 443,728 | +6 | 468,730 | +3 | 481,351 | +1 | 488,119 |
Total Working Age Population:
Total Households:
Total Working Age Population:
Total Households:
Total Working Age Population:
Total Households: