Industrial Properties
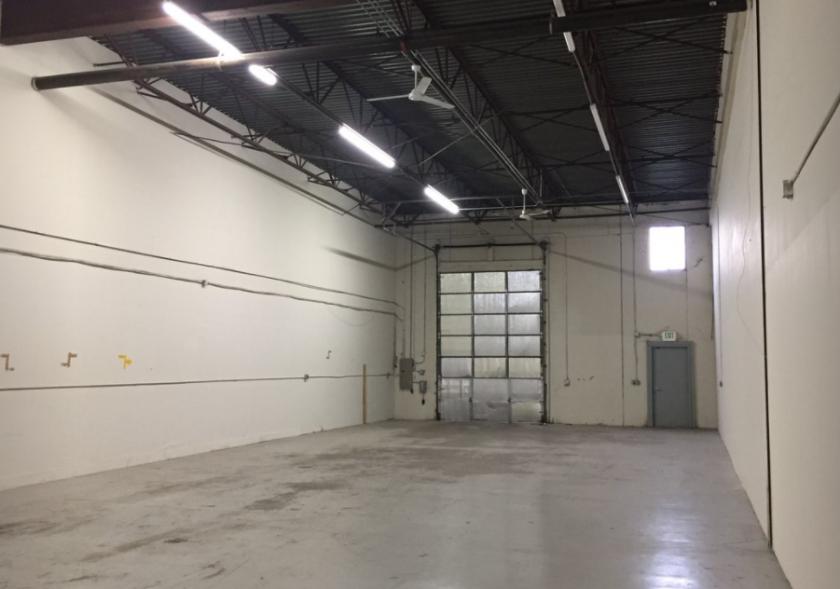
3544 Roger B Chaffee Memorial Boulevard Southeast Grand Rapids, MI 49548
3544 Roger B Chaffee Memorial Boulevard Southeast Grand Rapids, MI 49548

Details & Description
Listing Agents

Andrew Kapanowski
O: 616-776-0100
M: 734-546-3618
andrewk@naiwwm.com
O: 616-776-0100
M: 734-546-3618
andrewk@naiwwm.com
While we strive to provide the most accurate information, all listing information, and demographic data, is provided by third-parties. As such, MyEListing will not be responsible for the accuracy of the information. It is strongly recommended that you verify all information with the listing agent, and any relevant agencies, prior to making any decisions.