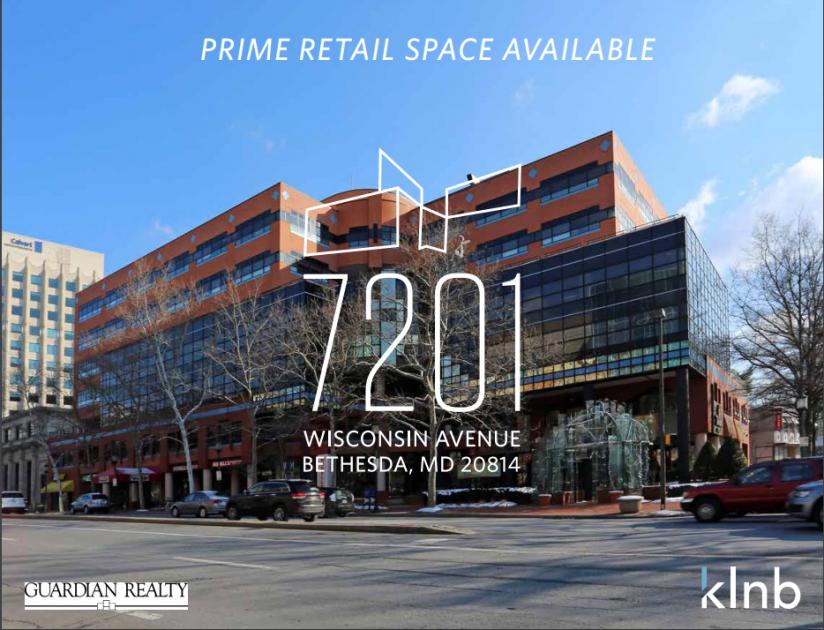
13,000 SF of prime street level space available immediately on the corner of Wisconsin Avenue and Willow Ln in the heart of Bethesda’s Business District
Ability to create an additional 21,752 SF of contiguous
2nd level space
5,116 SF of lower level storage space available
Fantastic signage opportunity to Wisconsin Avenue’s (Route 355) 49,742 cars per day
14’ 7’ Ceiling Heights
Potential onsite parking in 228 space parking garage with two charging stations in the building
Strategically located adjacent to two Montgomery County surface parking lots consisting of 316 parking spaces
Close proximity to Bethesda Row and Bethesda Metro and across street from soon to be Purple Line
No part of this information may be copied, reproduced, repurposed, or screen-captured for any commercial purpose without prior written authorization from MyEListing.
While we strive to provide the most accurate information, all listing information, and demographic data, is provided by third-parties. As such, MyEListing will not be responsible for the accuracy of the information. It is strongly recommended that you verify all information with the listing agent, and any relevant agencies, prior to making any decisions.
What is the building size of this commercial Retail property?
The size of this lease property at '.7201 Wisconsin Avenue.' is 13000 square feet
What kind of Retail is the propery at 7201 Wisconsin Avenue?
The property at 7201 Wisconsin Avenue Bethesda, MD 20814 is listed as a Shopping Center Retail property
What is the population within 1 mile of 7201 Wisconsin Avenue in Bethesda?
The population within 1 mile of 7201 Wisconsin Avenue Bethesda, MD 20814 is 22,862 people.
Who do I contact for questions about 7201 Wisconsin Avenue?
You should contact the listing agent,
Matt Skalet, for any details regarding this commercial listing.