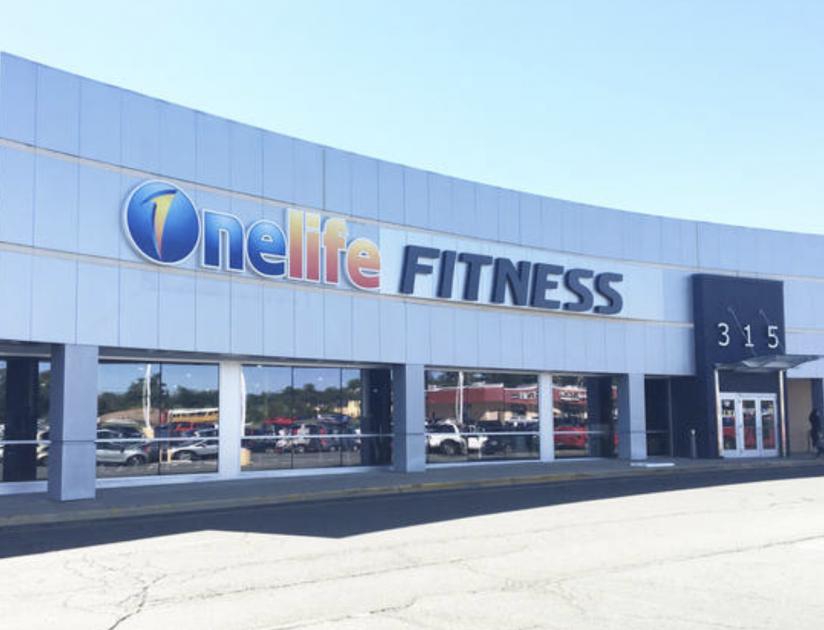
Anchored by strong regional fitness center, Onelife Fitness.
Located off of I-95, one exit south of Quantico Marine Corps Base which has over 140,000 personnel, civilians & family members.
Located on Garrisonville Road - one of the busiest retail corriders in Stafford County.
Stafford County is currently the 17th wealthiest locality in the United States, and is currently the 5th wealthiest county in Virginia.
25 miles south of the Washington DC Beltway.
Highly educated - 60% of the population has a bachelor's degree or higher.
No part of this information may be copied, reproduced, repurposed, or screen-captured for any commercial purpose without prior written authorization from MyEListing.
While we strive to provide the most accurate information, all listing information, and demographic data, is provided by third-parties. As such, MyEListing will not be responsible for the accuracy of the information. It is strongly recommended that you verify all information with the listing agent, and any relevant agencies, prior to making any decisions.
What is the building size of this commercial Retail property?
The size of this lease property at '.305 Garrisonville Rd.' is 3000 square feet
What kind of Retail is the propery at 305 Garrisonville Rd?
The property at 305 Garrisonville Rd Stafford, VA 22554 is listed as a Shopping Center Retail property
What is the population within 1 mile of 305 Garrisonville Rd in Stafford?
The population within 1 mile of 305 Garrisonville Rd Stafford, VA 22554 is 10,530 people.
Who do I contact for questions about 305 Garrisonville Rd?
You should contact the listing agent,
Dallon L. Cheney, for any details regarding this commercial listing.