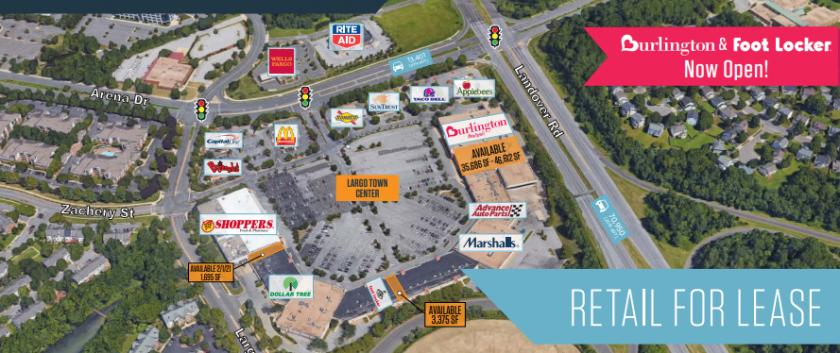
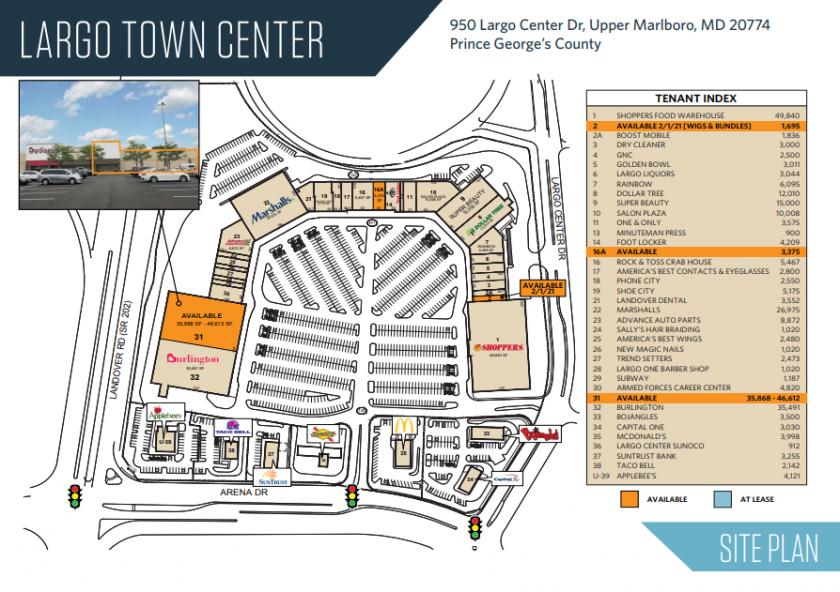
1-Mile | 3-Miles | 5-Miles | ||
---|---|---|---|---|
Total Population | 11,169 | 86,474 | 239,117 | |
Population Median Age | 39 | 39 | 39 | |
Population by Age | 0-9 Yrs | 1278 (11%) | 10408 (12%) | 30995 (12%) |
10-19 Yrs | 1069 (9%) | 10117 (11%) | 28370 (11%) | |
20-29 Yrs | 1699 (15%) | 11100 (12%) | 31441 (13%) | |
30-39 Yrs | 1844 (16%) | 11794 (13%) | 33538 (14%) | |
40-49 Yrs | 1515 (13%) | 11440 (13%) | 30569 (12%) | |
50-59 Yrs | 1643 (14%) | 12495 (14%) | 34739 (14%) | |
60-69 Yrs | 1352 (12%) | 10790 (12%) | 29045 (12%) | |
70+ Yrs | 769 (6%) | 8330 (9%) | 20420 (8%) | |
Median HH Income | $89,732 | $89,999 | $81,484 | |
Total Household Income | < 24K | 431 (8%) | 2855 (9%) | 10330 (12%) |
25-49K | 668 (13%) | 4208 (13%) | 13182 (15%) | |
50-74K | 830 (16%) | 5304 (16%) | 15478 (18%) | |
75-99K | 991 (19%) | 5517 (17%) | 12620 (14%) | |
100-199K | 1859 (36%) | 10563 (33%) | 25301 (29%) | |
200K+ | 247 (4%) | 2908 (9%) | 7617 (9%) | |
Highest Education Level | No Diploma | 348 | 4833 | 18588 |
Diploma or GED | 1536 | 16164 | 47911 | |
Some College | 1840 | 13793 | 37437 | |
Assoc. Degree | 575 | 3653 | 9939 | |
Bachelors Degree | 2302 | 12477 | 28987 | |
Higher Degree | 1578 | 9930 | 22541 | |
Total Housing Units | 5,585 | 33,689 | 90,489 | |
--Owner-Occupied | 2,593 | 21,549 | 56,484 | |
--Renter-Occupied | 2,433 | 9,805 | 28,043 | |
Owner-Occupied Values | < 100K | 214 | 1043 | 2586 |
100-199K | 409 | 3522 | 9527 | |
200-299K | 949 | 7390 | 19269 | |
300-399K | 750 | 5866 | 14249 | |
400-499K | 197 | 2259 | 6240 | |
500K+ | 74 | 1470 | 4613 | |
Total Working Age Population | 9,227 | 69,984 | 190,700 | |
In Work Force | 7,099 | 49,719 | 134,479 | |
Not In Work Force | 2,129 | 20,265 | 56,221 | |
Workforce Employed | 6,623 | 46,408 | 124,168 | |
Workforce Unemployed | 458 | 3,134 | 10,042 | |
Civlian Workforce | 7,081 | 49,542 | 134,210 | |
Military Workforce | 18 | 177 | 269 | |
Total Households | 5,026 | 31,354 | 84,526 | |
Family Households | 2,372 | 20,059 | 55,253 | |
Non-Family Households | 2,653 | 11,295 | 29,273 | |
Married Couple | 1,268 | 11,298 | 30,364 | |
Other Family | 1,105 | 8,761 | 24,889 | |
Married w/Child | 439 | 4,066 | 11,292 | |
Single Male w/Child | 101 | 583 | 1,943 | |
Single Female w/Child | 477 | 2,993 | 8,367 |
Population Change Last Two Decades - Plus Projection
2000 | % | 2010 | % | 2020 | % | 2030 | |
---|---|---|---|---|---|---|---|
District of Columbia | 572,059 | +5 | 601,723 | +21 | 729,501 | +15 | 842,154 |
Maryland | 5,296,486 | +9 | 5,773,552 | +6 | 6,141,900 | +6 | 6,518,750 |
Anne Arundel County | 489,656 | +10 | 537,656 | +7 | 573,250 | +4 | 596,700 |
Montgomery County | 873,341 | +11 | 971,777 | +8 | 1,052,050 | +7 | 1,128,800 |
Prince Georges County | 801,515 | +8 | 863,420 | +6 | 916,150 | +4 | 952,950 |
Total Working Age Population:
Total Households:
Total Working Age Population:
Total Households:
Total Working Age Population:
Total Households: