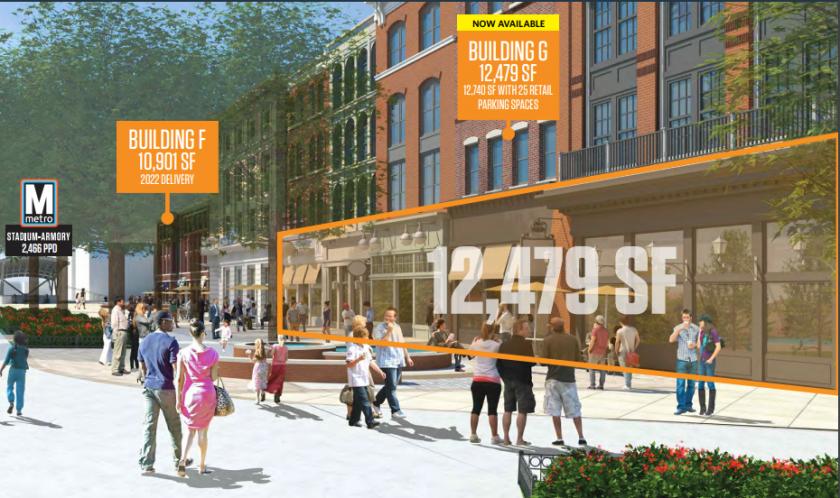
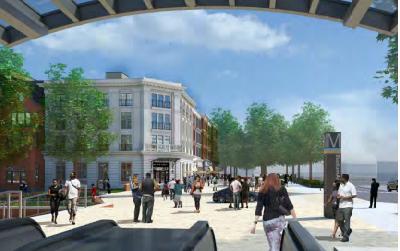
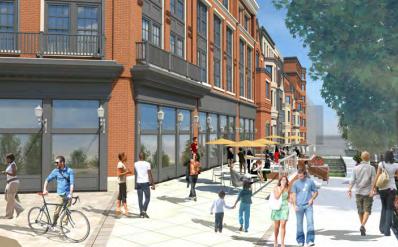
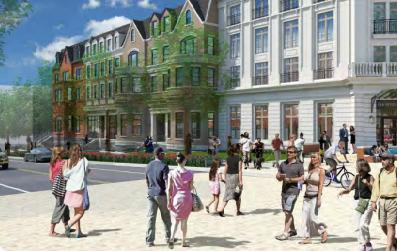
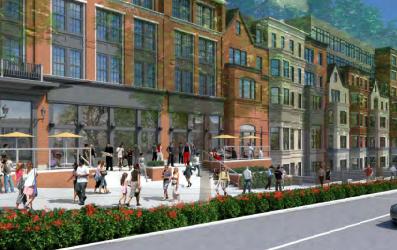
• 60 plus acre multi-phased mixed use development
-Phase I to include 25,000 SF of retail with parking and 350-400 residential unit (14,300 SF of Retail in Building G and 10,901 SF of Retail in Building F)
• Adjacent to Stadium/Armory Metro with approximately 6,000 riders per day
• Easily accessible from I-295, Independence Avenue and East Capitol Street
• Prime frontage on Massachusetts Avenue, SE
• Greatly underserved neighborhood
No part of this information may be copied, reproduced, repurposed, or screen-captured for any commercial purpose without prior written authorization from MyEListing.
While we strive to provide the most accurate information, all listing information, and demographic data, is provided by third-parties. As such, MyEListing will not be responsible for the accuracy of the information. It is strongly recommended that you verify all information with the listing agent, and any relevant agencies, prior to making any decisions.
What is the building size of this commercial Retail property?
The size of this lease property at '.1900 Massachusetts Avenue Southeast.' is 23701 square feet
What kind of Retail is the propery at 1900 Massachusetts Avenue Southeast?
The property at 1900 Massachusetts Avenue Southeast Washington, DC 20003 is listed as a Shopping Center Retail property
What is the population within 1 mile of 1900 Massachusetts Avenue Southeast in Washington?
The population within 1 mile of 1900 Massachusetts Avenue Southeast Washington, DC 20003 is 38,709 people.
Who do I contact for questions about 1900 Massachusetts Avenue Southeast?
You should contact the listing agent,
Matt Skalet, for any details regarding this commercial listing.