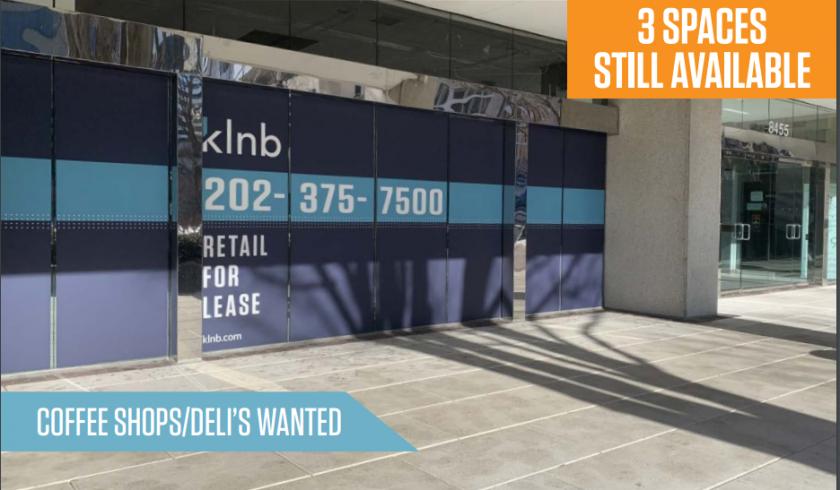
Retail Space
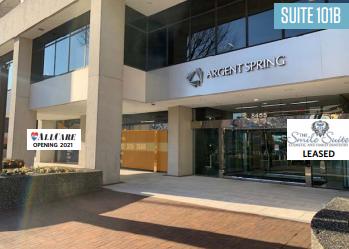
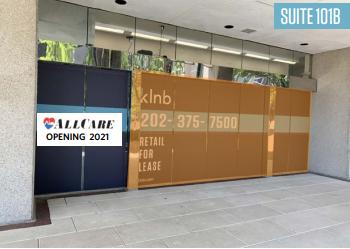
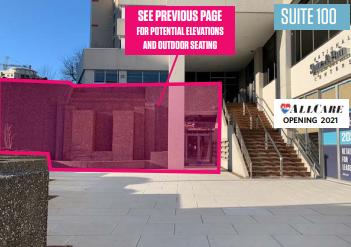
8455 Colesville Road Silver Spring, MD 20910
8455 Colesville Road Silver Spring, MD 20910
Details & Description
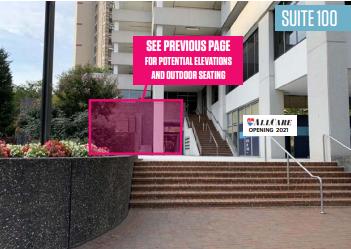
Additional Photos
Listing Agents

Matt Skalet
O: 202-420-7775
M: 202-577-7688
mskalet@klnb.com
O: 202-420-7775
M: 202-577-7688
mskalet@klnb.com

Phil Ruxton
O: 202-420-7777
M: 703-909-2454
pruxton@klnb.com
O: 202-420-7777
M: 703-909-2454
pruxton@klnb.com
While we strive to provide the most accurate information, all listing information, and demographic data, is provided by third-parties. As such, MyEListing will not be responsible for the accuracy of the information. It is strongly recommended that you verify all information with the listing agent, and any relevant agencies, prior to making any decisions.


