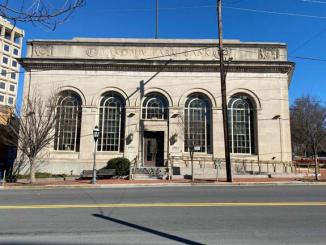
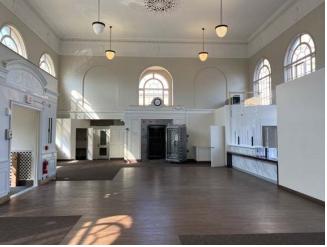
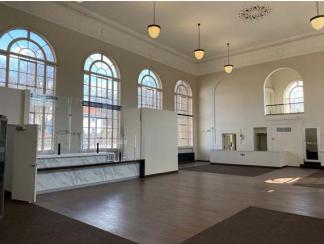
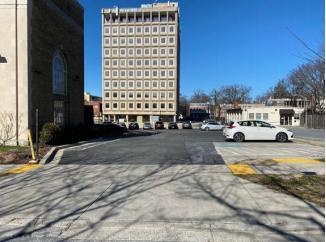
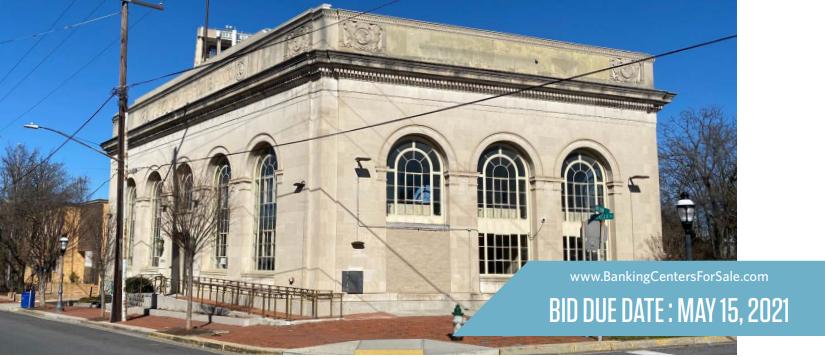
1-Mile | 3-Miles | 5-Miles | ||
---|---|---|---|---|
Total Population | 29,939 | 285,541 | 724,470 | |
Population Median Age | 39 | 37 | 37 | |
Population by Age | 0-9 Yrs | 3655 (12%) | 41184 (14%) | 85282 (11%) |
10-19 Yrs | 3085 (10%) | 29580 (10%) | 74493 (10%) | |
20-29 Yrs | 3210 (10%) | 42275 (14%) | 128160 (17%) | |
30-39 Yrs | 4970 (16%) | 52444 (18%) | 136952 (18%) | |
40-49 Yrs | 4768 (15%) | 38081 (13%) | 92911 (12%) | |
50-59 Yrs | 4088 (13%) | 32533 (11%) | 79819 (11%) | |
60-69 Yrs | 3588 (11%) | 27005 (9%) | 66415 (9%) | |
70+ Yrs | 2575 (8%) | 22441 (7%) | 60438 (8%) | |
Median HH Income | $92,252 | $81,235 | $95,439 | |
Total Household Income | < 24K | 1483 (13%) | 13618 (13%) | 37719 (13%) |
25-49K | 1865 (17%) | 17254 (17%) | 37840 (13%) | |
50-74K | 1334 (12%) | 15432 (15%) | 37031 (13%) | |
75-99K | 1131 (10%) | 12042 (12%) | 33462 (11%) | |
100-199K | 2937 (26%) | 25809 (26%) | 81332 (29%) | |
200K+ | 2174 (19%) | 14460 (14%) | 52516 (18%) | |
Highest Education Level | No Diploma | 2312 | 37400 | 65226 |
Diploma or GED | 3580 | 34695 | 69739 | |
Some College | 3283 | 26599 | 57579 | |
Assoc. Degree | 855 | 8193 | 17522 | |
Bachelors Degree | 4729 | 41298 | 129151 | |
Higher Degree | 7330 | 49960 | 174013 | |
Total Housing Units | 11,634 | 105,313 | 301,767 | |
--Owner-Occupied | 6,267 | 44,863 | 128,913 | |
--Renter-Occupied | 4,658 | 53,751 | 150,987 | |
Owner-Occupied Values | < 100K | 103 | 1389 | 2690 |
100-199K | 130 | 1815 | 4067 | |
200-299K | 337 | 4603 | 10990 | |
300-399K | 763 | 6189 | 19858 | |
400-499K | 1076 | 6899 | 20270 | |
500K+ | 3858 | 23969 | 71039 | |
Total Working Age Population | 24,354 | 226,443 | 599,838 | |
In Work Force | 17,631 | 166,478 | 439,976 | |
Not In Work Force | 6,723 | 59,964 | 159,862 | |
Workforce Employed | 16,448 | 156,944 | 416,903 | |
Workforce Unemployed | 1,170 | 9,316 | 21,459 | |
Civlian Workforce | 17,618 | 166,260 | 438,361 | |
Military Workforce | 14 | 218 | 1,614 | |
Total Households | 10,925 | 98,615 | 279,900 | |
Family Households | 6,717 | 58,465 | 139,442 | |
Non-Family Households | 4,208 | 40,150 | 140,457 | |
Married Couple | 4,293 | 36,693 | 97,496 | |
Other Family | 2,425 | 21,772 | 41,947 | |
Married w/Child | 2,040 | 17,689 | 42,263 | |
Single Male w/Child | 312 | 3,989 | 6,455 | |
Single Female w/Child | 658 | 5,600 | 12,443 |
Population Change Last Two Decades - Plus Projection
2000 | % | 2010 | % | 2020 | % | 2030 | |
---|---|---|---|---|---|---|---|
District of Columbia | 572,059 | +5 | 601,723 | +21 | 729,501 | +15 | 842,154 |
Maryland | 5,296,486 | +9 | 5,773,552 | +6 | 6,141,900 | +6 | 6,518,750 |
Montgomery County | 873,341 | +11 | 971,777 | +8 | 1,052,050 | +7 | 1,128,800 |
Prince Georges County | 801,515 | +8 | 863,420 | +6 | 916,150 | +4 | 952,950 |
Virginia | 7,078,515 | +13 | 8,001,024 | +8 | 8,655,021 | +8 | 9,331,666 |
Arlington County | 189,453 | +10 | 207,627 | +20 | 249,298 | +10 | 274,339 |
Fairfax County | 969,749 | +12 | 1,081,726 | +7 | 1,162,504 | +7 | 1,244,025 |
Total Working Age Population:
Total Households:
Total Working Age Population:
Total Households:
Total Working Age Population:
Total Households: