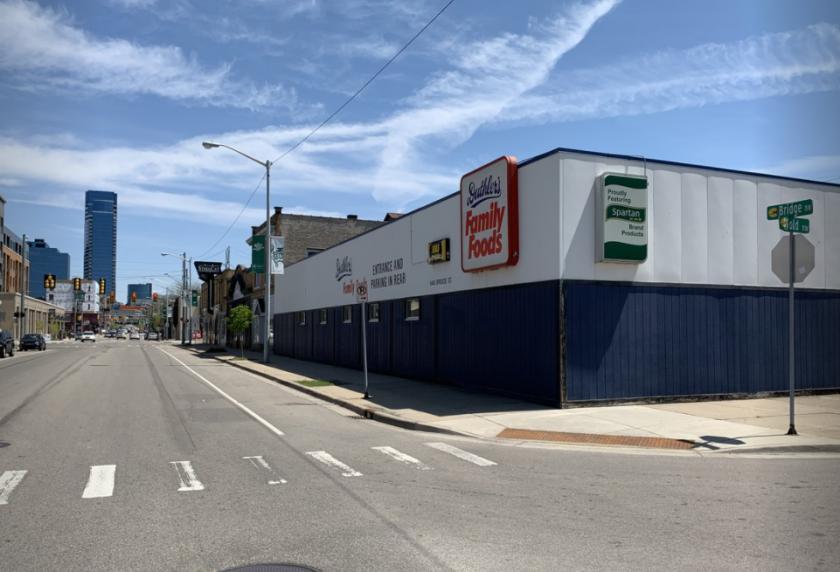
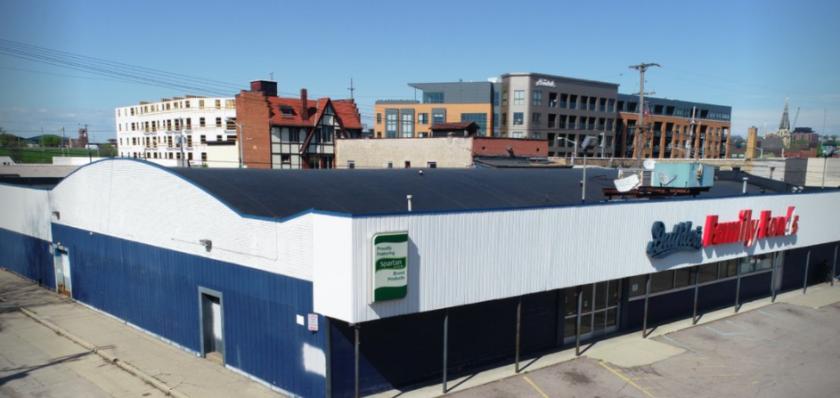
1-Mile | 3-Miles | 5-Miles | ||
---|---|---|---|---|
Total Population | 18,852 | 124,335 | 253,586 | |
Population Median Age | 32 | 34 | 35 | |
Population by Age | 0-9 Yrs | 2055 (10%) | 16275 (13%) | 34870 (13%) |
10-19 Yrs | 2052 (10%) | 15937 (12%) | 31273 (12%) | |
20-29 Yrs | 5963 (31%) | 30014 (24%) | 50786 (20%) | |
30-39 Yrs | 3109 (16%) | 19664 (15%) | 38867 (15%) | |
40-49 Yrs | 1861 (9%) | 12592 (10%) | 27028 (10%) | |
50-59 Yrs | 1876 (9%) | 12865 (10%) | 28696 (11%) | |
60-69 Yrs | 1221 (6%) | 9565 (7%) | 22796 (8%) | |
70+ Yrs | 715 (3%) | 7422 (5%) | 19270 (7%) | |
Median HH Income | $46,050 | $48,284 | $52,911 | |
Total Household Income | < 24K | 2109 (28%) | 12056 (25%) | 21330 (22%) |
25-49K | 1954 (26%) | 12097 (25%) | 24602 (25%) | |
50-74K | 1247 (16%) | 9164 (19%) | 18858 (19%) | |
75-99K | 871 (11%) | 5646 (12%) | 12588 (13%) | |
100-199K | 905 (12%) | 6392 (13%) | 15466 (16%) | |
200K+ | 284 (3%) | 1337 (2%) | 3682 (3%) | |
Highest Education Level | No Diploma | 1302 | 11698 | 21339 |
Diploma or GED | 2620 | 17942 | 38537 | |
Some College | 2670 | 16365 | 34803 | |
Assoc. Degree | 965 | 5998 | 13412 | |
Bachelors Degree | 2675 | 18015 | 38152 | |
Higher Degree | 1148 | 7871 | 18240 | |
Total Housing Units | 8,700 | 51,876 | 103,770 | |
--Owner-Occupied | 2,927 | 24,215 | 56,827 | |
--Renter-Occupied | 4,444 | 22,477 | 39,699 | |
Owner-Occupied Values | < 100K | 1014 | 7731 | 13422 |
100-199K | 1249 | 12244 | 29000 | |
200-299K | 304 | 2779 | 8513 | |
300-399K | 179 | 845 | 2807 | |
400-499K | 33 | 202 | 1204 | |
500K+ | 149 | 414 | 1880 | |
Total Working Age Population | 15,562 | 98,593 | 199,400 | |
In Work Force | 12,183 | 70,376 | 139,830 | |
Not In Work Force | 3,380 | 28,218 | 59,570 | |
Workforce Employed | 11,514 | 65,927 | 132,216 | |
Workforce Unemployed | 669 | 4,417 | 7,477 | |
Civlian Workforce | 12,183 | 70,344 | 139,693 | |
Military Workforce | 0 | 31 | 136 | |
Total Households | 7,371 | 46,692 | 96,526 | |
Family Households | 3,469 | 24,899 | 55,861 | |
Non-Family Households | 3,902 | 21,793 | 40,665 | |
Married Couple | 1,997 | 15,179 | 37,729 | |
Other Family | 1,472 | 9,720 | 18,132 | |
Married w/Child | 775 | 6,307 | 15,585 | |
Single Male w/Child | 201 | 1,449 | 2,734 | |
Single Female w/Child | 618 | 4,322 | 7,867 |
Population Change Last Two Decades - Plus Projection
2000 | % | 2010 | % | 2020 | % | 2030 | |
---|---|---|---|---|---|---|---|
Michigan | 9,938,444 | -1 | 9,883,640 | +1 | 10,023,423 | +4 | 10,424,510 |
Kent County | 574,335 | +5 | 602,622 | +11 | 668,535 | +12 | 746,921 |
Ottawa County | 238,314 | +11 | 263,801 | +12 | 295,791 | +12 | 331,723 |
Total Working Age Population:
Total Households:
Total Working Age Population:
Total Households:
Total Working Age Population:
Total Households: