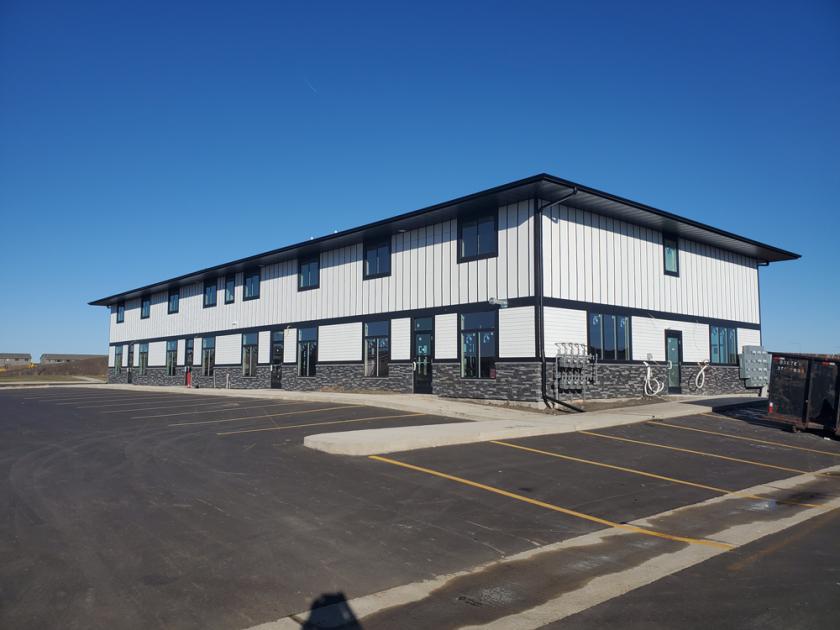
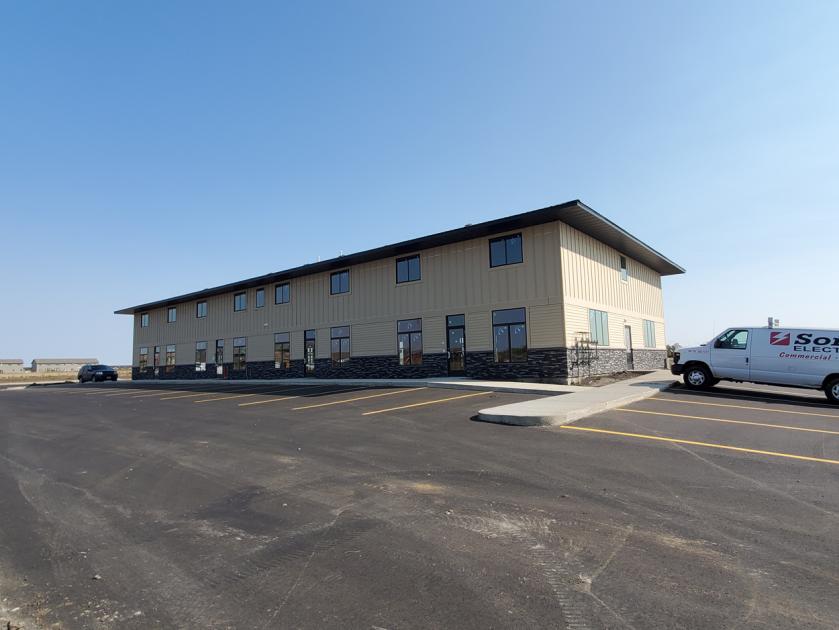
New development located on the corner of Main Ave & 271st St in Tea
Mixed-use building, plans for 8 multi-family units on the 2nd level
Available December 1, 2020
52 surface level parking spaces
Main level retail/office space includes 6,500 sq. ft. Space can be demised in several ways including:
One 6,500 sq. ft. suite
Two 3,250 sq. ft. suites
Four 1,625 sq. ft. suites
Smaller demised spaces are possible
Contact broker for details on prospective suite sizes
Building signage
Landlord will bring the space to shell condition prior to tenant build-out
3 – 5 year leases
Co-listed with David Mettler - Keller Williams
Price
Lease rate: $14.85/ sq. ft. NNN
Estimated NNN: $3.50/sq. ft. - $4.50/sq. ft.
Location
Located just south of 271st Street,
Area neighbors include: Bath Fitter, Stone Holding Company, Dakota Traffic Services, ProChem Dynamics, Ahrendt Designs
No part of this information may be copied, reproduced, repurposed, or screen-captured for any commercial purpose without prior written authorization from MyEListing.
While we strive to provide the most accurate information, all listing information, and demographic data, is provided by third-parties. As such, MyEListing will not be responsible for the accuracy of the information. It is strongly recommended that you verify all information with the listing agent, and any relevant agencies, prior to making any decisions.
What is the asking price for 1500 North Main Avenue in Tea?
The asking price for 1500 North Main Avenue is $
What is the building size of this commercial Retail property?
The size of this lease property at '.1500 North Main Avenue.' is 6500 square feet
What kind of Retail is the propery at 1500 North Main Avenue?
The property at 1500 North Main Avenue Tea, SD 57064 is listed as a Free Standing Building Retail property
What is the population within 1 mile of 1500 North Main Avenue in Tea?
The population within 1 mile of 1500 North Main Avenue Tea, SD 57064 is 3,600 people.
Who do I contact for questions about 1500 North Main Avenue?
You should contact the listing agent,
Marcus Mahlen, for any details regarding this commercial listing.