Commercial Land
3531 Old Ranch Road Colorado Springs, CO 80908
3531 Old Ranch Road Colorado Springs, CO 80908

Details & Description
Property Highlights
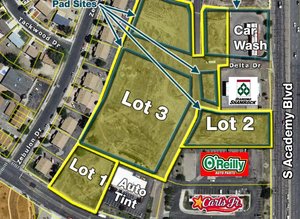
• Only two (2) parcels remaining: − CN-1: retail & office pad sites − BXE-5: retail pad sites
• Many possible uses including retail, office, medical office, hotel & entertainment
Listing Agents

Craig Anderson
O: 719-667-6875
M: 719-963-6203
anderson@highlandcommercial.com
O: 719-667-6875
M: 719-963-6203
anderson@highlandcommercial.com

Michael Suggs
O: 719-338-4555
M: 719-338-4555
suggs@highlandcommercial.com
O: 719-338-4555
M: 719-338-4555
suggs@highlandcommercial.com
While we strive to provide the most accurate information, all listing information, and demographic data, is provided by third-parties. As such, MyEListing will not be responsible for the accuracy of the information. It is strongly recommended that you verify all information with the listing agent, and any relevant agencies, prior to making any decisions.