Commercial Land
Duckwood Road Fountain, CO 80817
Duckwood Road Fountain, CO 80817

Details & Description
Property Highlights
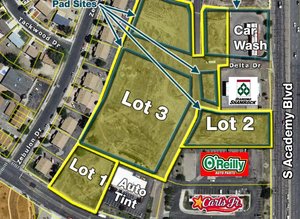
- • 40.75 Acres of land fronting Hwy 85-87
- • Backs to Fountain Regional Park
- • Just Minutes to Fort Carson
- • Can be Subdivided
Listing Agents

Craig Anderson
O: 719-667-6875
M: 719-963-6203
anderson@highlandcommercial.com
O: 719-667-6875
M: 719-963-6203
anderson@highlandcommercial.com
While we strive to provide the most accurate information, all listing information, and demographic data, is provided by third-parties. As such, MyEListing will not be responsible for the accuracy of the information. It is strongly recommended that you verify all information with the listing agent, and any relevant agencies, prior to making any decisions.