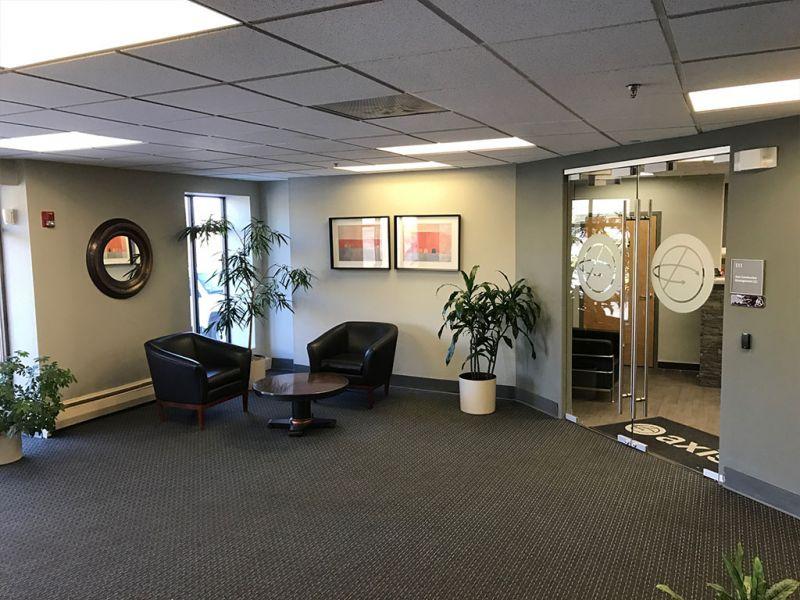
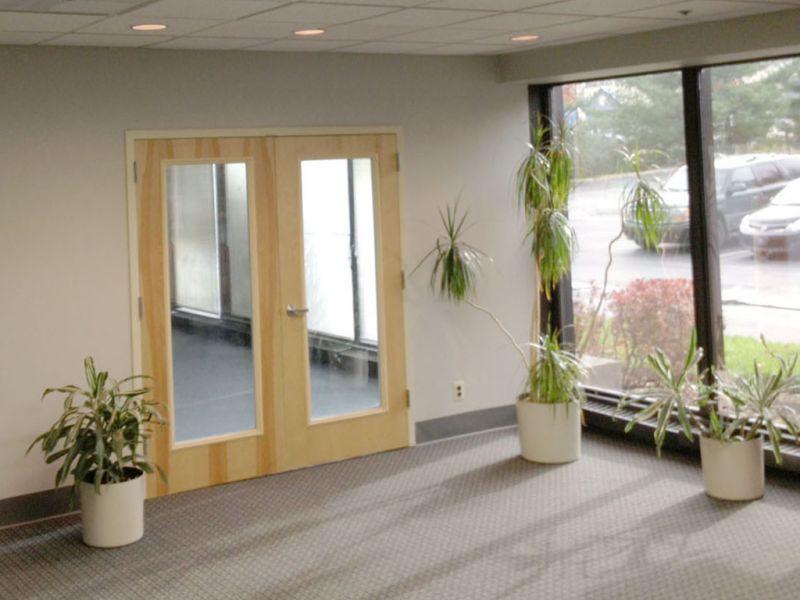
1-Mile | 3-Miles | 5-Miles | ||
---|---|---|---|---|
Total Population | 7,603 | 78,557 | 195,772 | |
Population Median Age | 37 | 37 | 39 | |
Population by Age | 0-9 Yrs | 898 (11%) | 10212 (12%) | 22413 (11%) |
10-19 Yrs | 729 (9%) | 10200 (12%) | 25724 (13%) | |
20-29 Yrs | 1186 (15%) | 12079 (15%) | 29281 (14%) | |
30-39 Yrs | 1795 (23%) | 12469 (15%) | 27885 (14%) | |
40-49 Yrs | 900 (11%) | 9276 (11%) | 22741 (11%) | |
50-59 Yrs | 835 (10%) | 9355 (11%) | 25007 (12%) | |
60-69 Yrs | 632 (8%) | 7854 (9%) | 21454 (10%) | |
70+ Yrs | 628 (8%) | 7112 (9%) | 21267 (10%) | |
Median HH Income | $88,169 | $77,824 | $87,791 | |
Total Household Income | < 24K | 357 (10%) | 4452 (14%) | 9428 (12%) |
25-49K | 501 (14%) | 5782 (18%) | 12360 (16%) | |
50-74K | 571 (16%) | 4871 (15%) | 11648 (15%) | |
75-99K | 610 (17%) | 4105 (13%) | 9829 (12%) | |
100-199K | 1190 (33%) | 7671 (24%) | 20716 (26%) | |
200K+ | 273 (7%) | 4257 (13%) | 12950 (16%) | |
Highest Education Level | No Diploma | 319 | 5255 | 9360 |
Diploma or GED | 917 | 11722 | 27020 | |
Some College | 598 | 7032 | 16802 | |
Assoc. Degree | 235 | 3010 | 7571 | |
Bachelors Degree | 2160 | 14671 | 40079 | |
Higher Degree | 1268 | 10769 | 32490 | |
Total Housing Units | 3,958 | 34,282 | 83,110 | |
--Owner-Occupied | 1,655 | 17,234 | 46,694 | |
--Renter-Occupied | 1,848 | 13,904 | 30,237 | |
Owner-Occupied Values | < 100K | 27 | 1111 | 1936 |
100-199K | 111 | 2831 | 7608 | |
200-299K | 806 | 3879 | 10692 | |
300-399K | 295 | 3530 | 8991 | |
400-499K | 170 | 1731 | 4337 | |
500K+ | 246 | 4152 | 13130 | |
Total Working Age Population | 6,140 | 62,792 | 160,014 | |
In Work Force | 4,743 | 43,685 | 107,213 | |
Not In Work Force | 1,397 | 19,107 | 52,802 | |
Workforce Employed | 4,547 | 41,475 | 102,012 | |
Workforce Unemployed | 149 | 2,143 | 5,101 | |
Civlian Workforce | 4,696 | 43,619 | 107,112 | |
Military Workforce | 47 | 66 | 100 | |
Total Households | 3,503 | 31,138 | 76,931 | |
Family Households | 1,836 | 19,172 | 47,894 | |
Non-Family Households | 1,667 | 11,966 | 29,037 | |
Married Couple | 1,545 | 13,375 | 36,445 | |
Other Family | 291 | 5,797 | 11,449 | |
Married w/Child | 713 | 5,492 | 14,793 | |
Single Male w/Child | 33 | 673 | 1,198 | |
Single Female w/Child | 130 | 2,630 | 4,537 |
Population Change Last Two Decades - Plus Projection
2000 | % | 2010 | % | 2020 | % | 2030 | |
---|---|---|---|---|---|---|---|
Pennsylvania | 12,281,054 | +3 | 12,702,379 | +4 | 13,230,170 | +4 | 13,759,594 |
Bucks County | 597,635 | +5 | 625,249 | +1 | 629,420 | +1 | 637,730 |
Chester County | 433,501 | +15 | 498,886 | +7 | 533,837 | +7 | 573,576 |
Delaware County | 550,864 | +1 | 558,979 | +5 | 588,436 | +6 | 622,307 |
Montgomery County | 750,097 | +7 | 799,874 | +5 | 838,883 | +6 | 891,868 |
Philadelphia County | 1,517,550 | +1 | 1,526,006 | +8 | 1,653,729 | +6 | 1,753,054 |
Total Working Age Population:
Total Households:
Total Working Age Population:
Total Households:
Total Working Age Population:
Total Households: