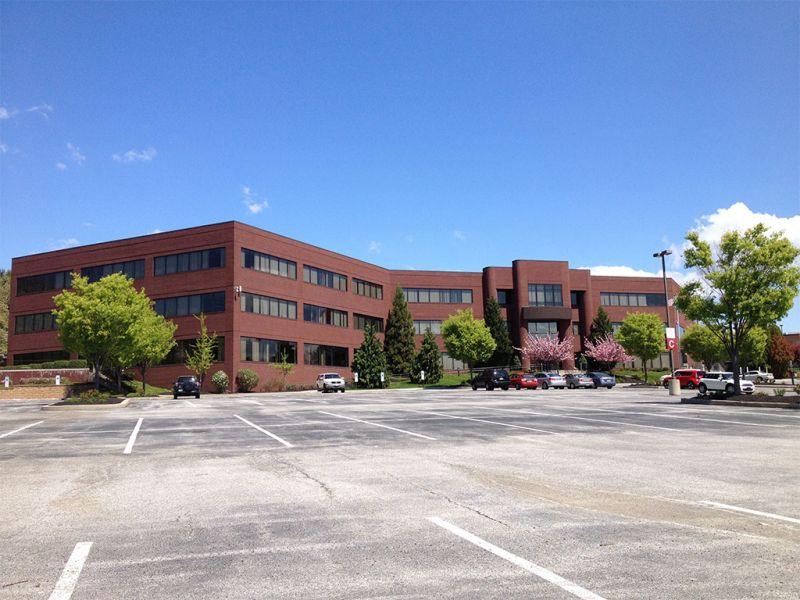
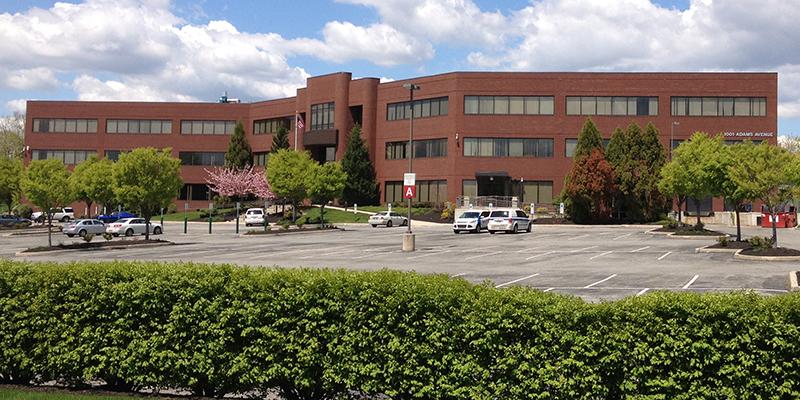
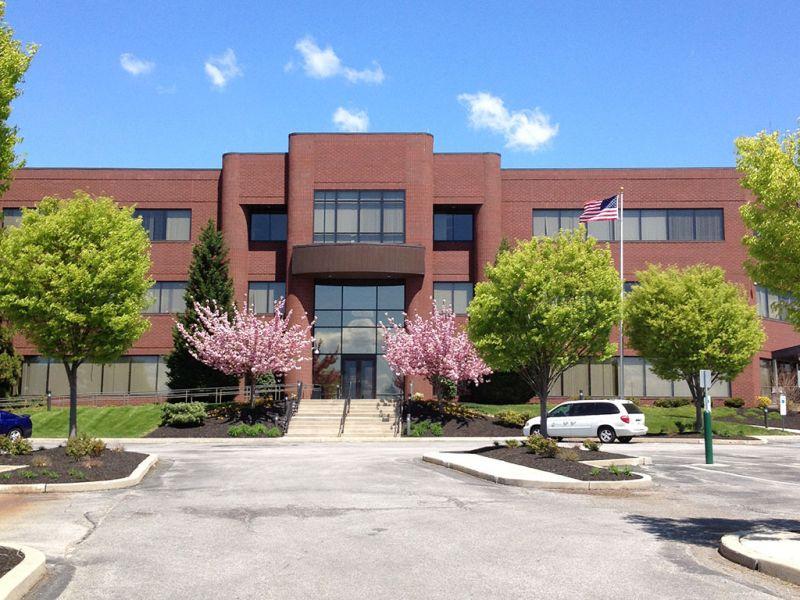
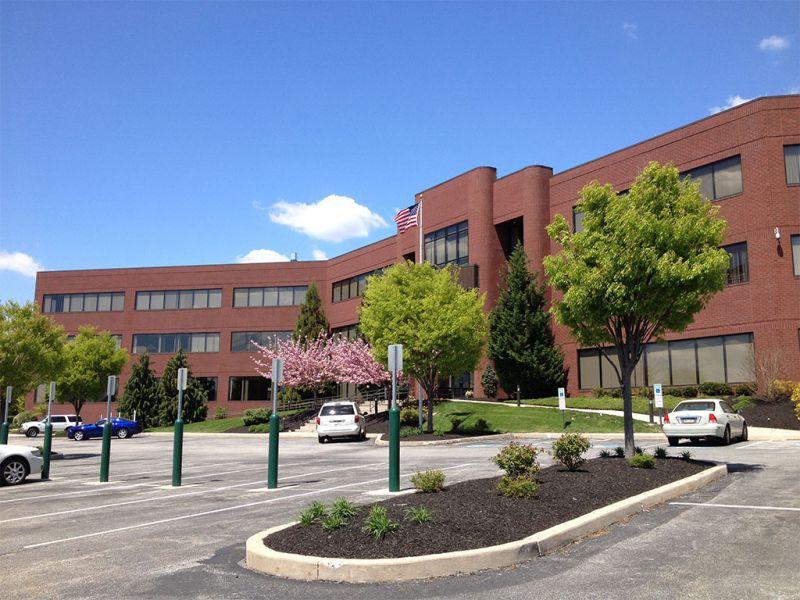
1-Mile | 3-Miles | 5-Miles | ||
---|---|---|---|---|
Total Population | 6,319 | 49,828 | 157,885 | |
Population Median Age | 43 | 41 | 39 | |
Population by Age | 0-9 Yrs | 628 (9%) | 5096 (10%) | 19494 (12%) |
10-19 Yrs | 605 (9%) | 5341 (10%) | 18714 (11%) | |
20-29 Yrs | 847 (13%) | 6321 (12%) | 20131 (12%) | |
30-39 Yrs | 1108 (17%) | 7292 (14%) | 22976 (14%) | |
40-49 Yrs | 657 (10%) | 6387 (12%) | 20636 (13%) | |
50-59 Yrs | 697 (11%) | 7262 (14%) | 22403 (14%) | |
60-69 Yrs | 414 (6%) | 5304 (10%) | 17098 (10%) | |
70+ Yrs | 1363 (21%) | 6825 (13%) | 16434 (10%) | |
Median HH Income | $87,050 | $93,510 | $88,765 | |
Total Household Income | < 24K | 399 (13%) | 1805 (9%) | 7149 (11%) |
25-49K | 476 (15%) | 2925 (14%) | 10065 (16%) | |
50-74K | 421 (14%) | 3008 (15%) | 9103 (14%) | |
75-99K | 423 (14%) | 3030 (15%) | 8256 (13%) | |
100-199K | 1008 (33%) | 6483 (32%) | 17870 (28%) | |
200K+ | 273 (9%) | 2712 (13%) | 9284 (15%) | |
Highest Education Level | No Diploma | 188 | 1798 | 8084 |
Diploma or GED | 656 | 8172 | 24823 | |
Some College | 696 | 4854 | 14617 | |
Assoc. Degree | 471 | 2415 | 6931 | |
Bachelors Degree | 1599 | 11530 | 32282 | |
Higher Degree | 1177 | 7864 | 23860 | |
Total Housing Units | 3,247 | 21,007 | 66,350 | |
--Owner-Occupied | 1,466 | 13,665 | 40,121 | |
--Renter-Occupied | 1,534 | 6,298 | 21,606 | |
Owner-Occupied Values | < 100K | 101 | 467 | 2005 |
100-199K | 226 | 2005 | 6908 | |
200-299K | 548 | 3765 | 9661 | |
300-399K | 481 | 4350 | 8764 | |
400-499K | 62 | 1293 | 4161 | |
500K+ | 47 | 1785 | 8622 | |
Total Working Age Population | 5,297 | 41,555 | 126,711 | |
In Work Force | 3,240 | 26,658 | 86,589 | |
Not In Work Force | 2,058 | 14,897 | 40,122 | |
Workforce Employed | 3,114 | 25,516 | 82,480 | |
Workforce Unemployed | 126 | 1,142 | 4,039 | |
Civlian Workforce | 3,240 | 26,658 | 86,519 | |
Military Workforce | 0 | 0 | 71 | |
Total Households | 3,000 | 19,963 | 61,727 | |
Family Households | 1,605 | 13,102 | 40,662 | |
Non-Family Households | 1,395 | 6,861 | 21,065 | |
Married Couple | 1,385 | 11,132 | 31,445 | |
Other Family | 220 | 1,970 | 9,217 | |
Married w/Child | 502 | 4,266 | 13,131 | |
Single Male w/Child | 12 | 154 | 1,101 | |
Single Female w/Child | 53 | 626 | 3,798 |
Population Change Last Two Decades - Plus Projection
2000 | % | 2010 | % | 2020 | % | 2030 | |
---|---|---|---|---|---|---|---|
Pennsylvania | 12,281,054 | +3 | 12,702,379 | +4 | 13,230,170 | +4 | 13,759,594 |
Bucks County | 597,635 | +5 | 625,249 | +1 | 629,420 | +1 | 637,730 |
Chester County | 433,501 | +15 | 498,886 | +7 | 533,837 | +7 | 573,576 |
Delaware County | 550,864 | +1 | 558,979 | +5 | 588,436 | +6 | 622,307 |
Montgomery County | 750,097 | +7 | 799,874 | +5 | 838,883 | +6 | 891,868 |
Total Working Age Population:
Total Households:
Total Working Age Population:
Total Households:
Total Working Age Population:
Total Households: