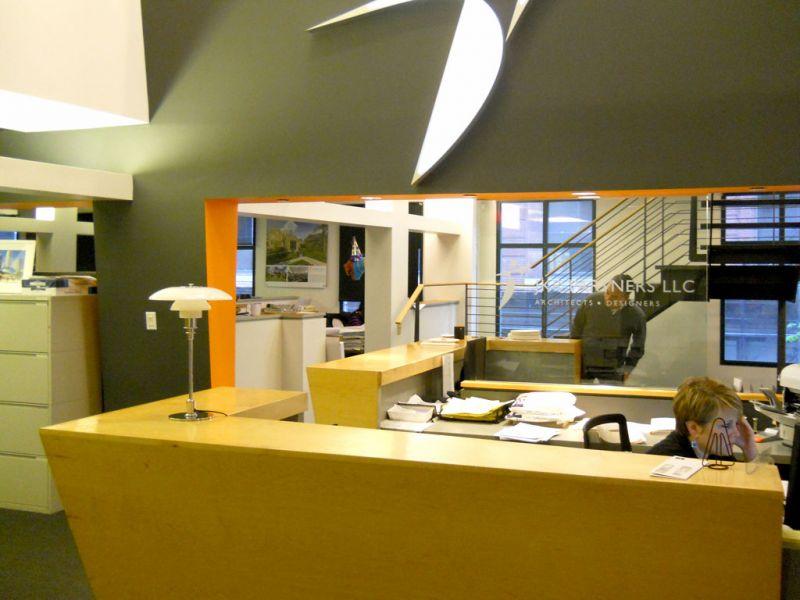
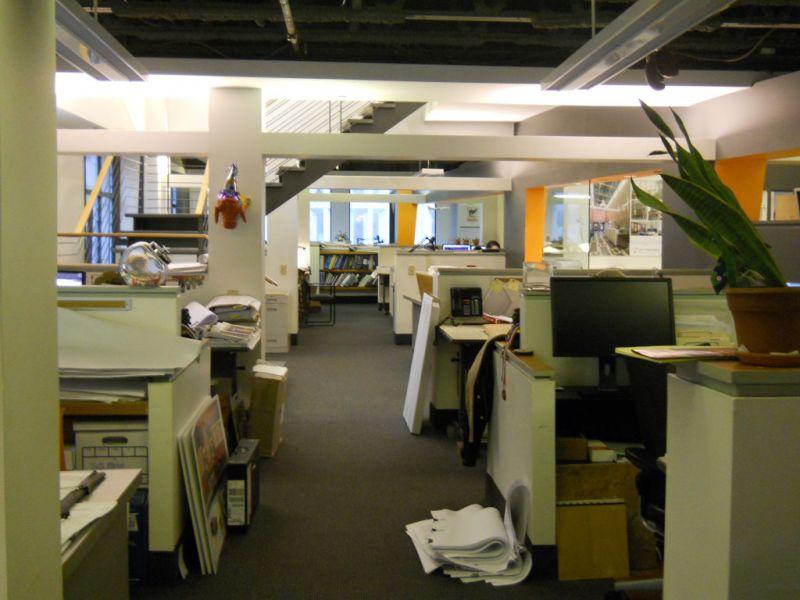
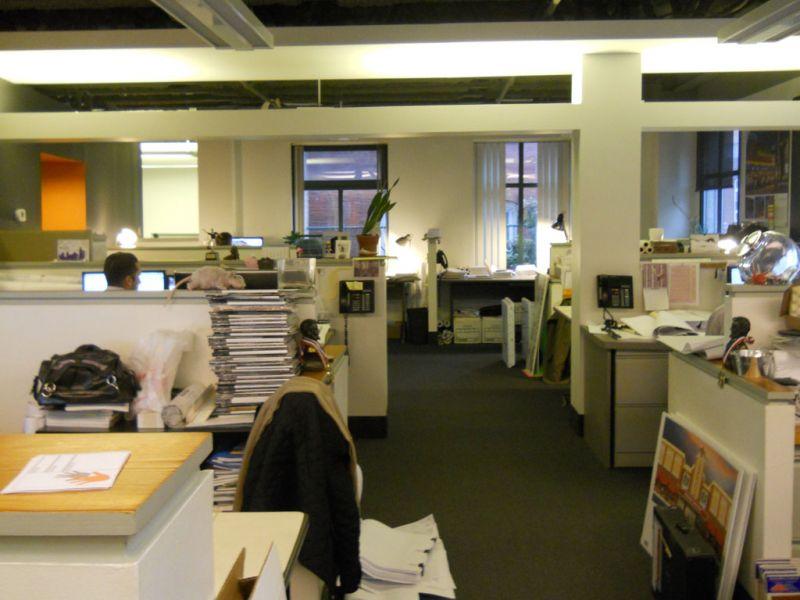
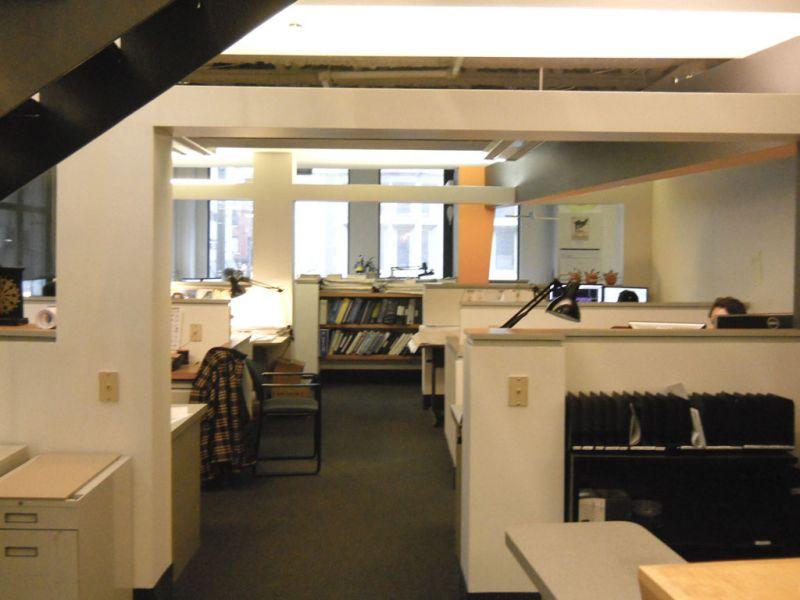
Two floors of exposed ceilings
Elevator and lobby renovations under way
Will provide in warm vanilla box shell condition
$26.50 net of electric
Granite exterior
Natural light from windows on three sides
Steps away from Jefferson Hospital and mass transit
Turn-key buildout at competitive rates
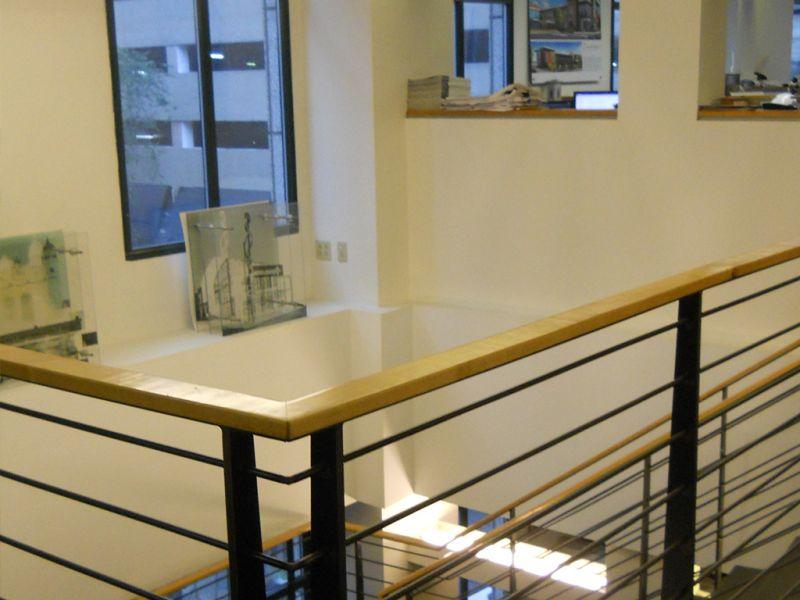
Dramatic 2nd and 3rd floor available with connecting stairway
Exposed ceilings, beautiful outside terrace
Significant signage opportunity
Starbucks recently renewed lease
Tenant concessions inclusive of free rent
No part of this information may be copied, reproduced, repurposed, or screen-captured for any commercial purpose without prior written authorization from MyEListing.
While we strive to provide the most accurate information, all listing information, and demographic data, is provided by third-parties. As such, MyEListing will not be responsible for the accuracy of the information. It is strongly recommended that you verify all information with the listing agent, and any relevant agencies, prior to making any decisions.
What is the asking price for 1128 Walnut Street in Philadelphia?
The asking price for 1128 Walnut Street is $26.50 a SF per Year
What is the building size of this commercial Office property?
The size of this multi-unit property varies between 727 - 3742 square feet
What kind of Office is the propery at 1128 Walnut Street?
The property at 1128 Walnut Street Philadelphia, PA 19107 is listed as a Professional Office property
What is the population within 1 mile of 1128 Walnut Street in Philadelphia?
The population within 1 mile of 1128 Walnut Street Philadelphia, PA 19107 is 85,218 people.
Who do I contact for questions about 1128 Walnut Street?
You should contact the listing agent,
Thomas Bond, for any details regarding this commercial listing.