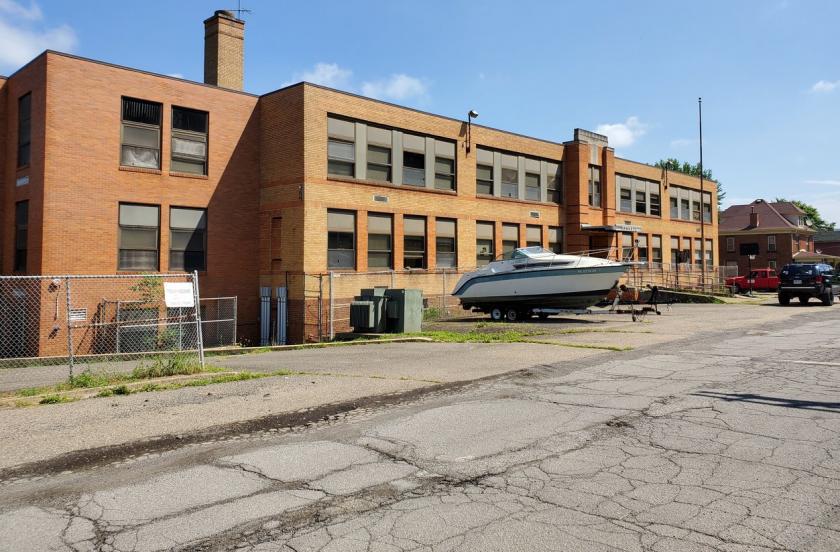
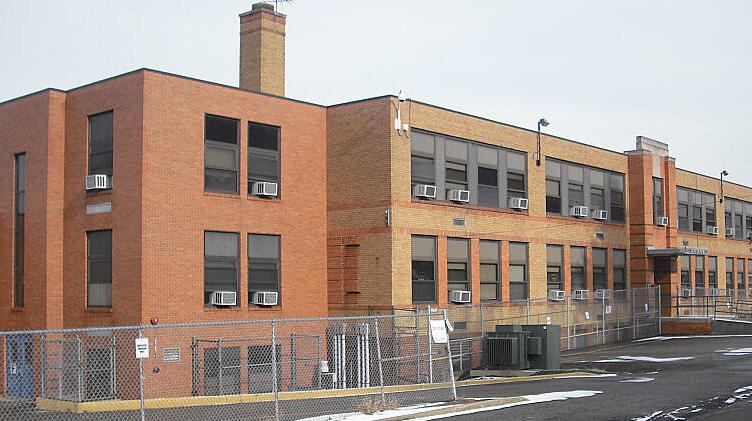
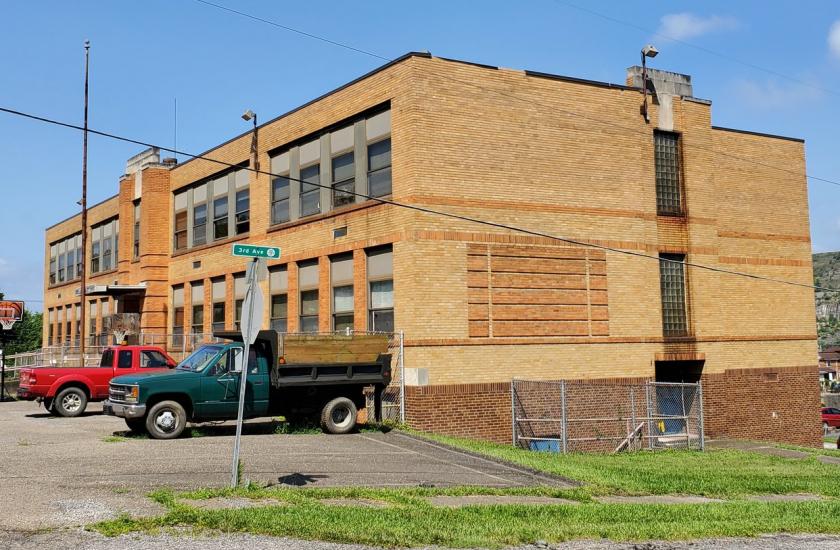
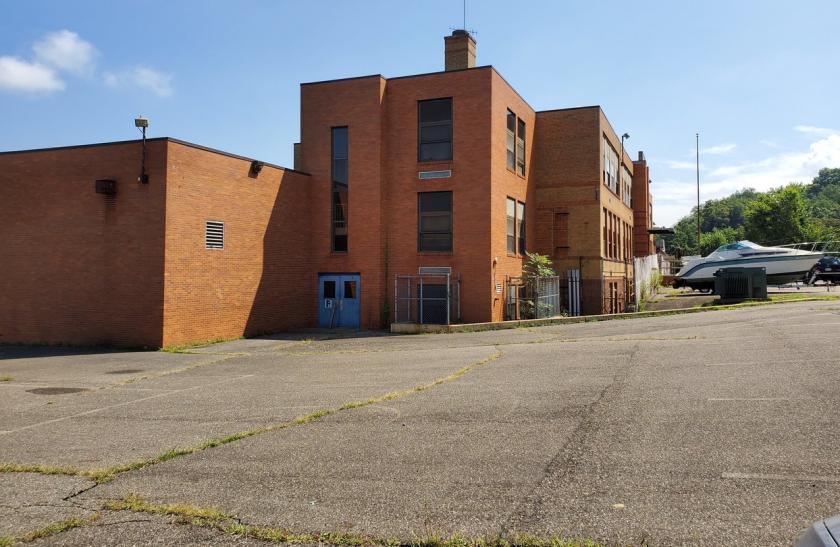
Property Description
Office space for lease from 250 SF - 37,000 SF for sale or lease
Located on WV Route 2 in the heart of the "Plastics Belt" along the Ohio
River Corridor
23 Miles to Shell Petrochemical Complex in Monaca PA
25 Miles to Pittsburgh International Airport
17 Miles to Weirton WV
Less than 2 miles to East Liverpool OH
45 Miles to Wheeling WV
105 Miles to Cleveland
Within Federal Opportunity Zone programProperty Highlights
• WILL ACCEPT BITCOIN FOR PAYMENT *Restrictions apply*
• ~3,600 SF Warehouse space
• Ample parking 60+ spaces
• 10 Executive level offices
• 30 Bullpen/work areas
• 10 Training rooms
• Heavy power
• Data & automation infrastructure in place
• 1st & 2nd Floor ADA (on grade)
• Recently upgraded HVAC Units
*Agent Interest
Bryce Custer, SIOR, CCIM, MRIcs is licensed in the state of West Virginia under JJ Guida Airport Realty, Jamie Guida Broker
WV.0030448
No part of this information may be copied, reproduced, repurposed, or screen-captured for any commercial purpose without prior written authorization from MyEListing.
While we strive to provide the most accurate information, all listing information, and demographic data, is provided by third-parties. As such, MyEListing will not be responsible for the accuracy of the information. It is strongly recommended that you verify all information with the listing agent, and any relevant agencies, prior to making any decisions.
What is the building size of this commercial Office property?
The size of this lease property at '.306 Jefferson Street.' is 37000 square feet
What is the population within 1 mile of 306 Jefferson Street in Newell?
The population within 1 mile of 306 Jefferson Street Newell, WV 26050 is 3,187 people.
Who do I contact for questions about 306 Jefferson Street?
You should contact the listing agent,
Bryce Custer, for any details regarding this commercial listing.